Find us at booth #83, join us for a harbor side happy hour, or catch Gorish’s talk.

Sept, 16-18 > Learn more

%20(1).avif)
Mamta Tainwala

April 6, 2026
Only 43% of sales leaders forecast within 10% accuracy, according to Outreach research. The other 57% are presenting numbers to their board that are functionally fiction. Some miss by 25% or more.
The gap between accurate and inaccurate forecasting is not luck. It is method. Teams that choose the right forecasting approach for their sales motion, data maturity, and deal complexity outperform those that guess, average, or rely on whatever their CRM defaults to.
This guide covers the 10 most effective sales forecasting methods, organized from simplest to most sophisticated. For each method, we explain how it works, when to use it, how to calculate it, and where it breaks down. We then provide a framework for choosing the right method (or combination) for your specific team, and show how AI is making every method more accurate by solving the data quality problem at the source.
Sales forecasting is the process of estimating how much revenue your team will generate over a specific period, typically a quarter or fiscal year. A good forecast answers two questions: how much revenue can we expect, and when will it arrive?
Forecasting informs virtually every strategic decision in a revenue organization. Hiring plans depend on projected revenue growth. Marketing budgets depend on pipeline coverage targets. Cash flow management depends on anticipated close dates. Investor confidence depends on the accuracy of your projections. And coaching priorities depend on which reps and deals are most likely to impact the number.
Inaccurate forecasts create cascading problems: overhiring when the pipeline is weaker than it appears, underspending on marketing when coverage is actually thin, and making commitments to leadership that erode trust when reality does not match projections.
The fix starts with choosing the right method.
Qualitative methods rely on human judgment, expert opinion, and subjective assessment rather than statistical models. They are most useful when historical data is limited, when entering new markets, or when launching products where no sales history exists.
How it works. Each sales rep estimates the likelihood of their deals closing based on their direct interactions with buyers. The manager aggregates these estimates into a team-level forecast.
When to use it. Early-stage startups with minimal historical data, or as a supplement to quantitative methods to add qualitative context.
The formula. No formal calculation. Each rep assigns a probability and expected close date to their deals. The sum of (deal value x rep-estimated probability) produces the forecast.
Where it breaks down. Rep optimism is the biggest enemy. Salesforce research shows that 84% of reps missed quota last year, yet most pipeline reports skew optimistic. Reps overestimate deals they are emotionally invested in and underestimate risk in deals that have gone quiet. This is the happy ears problem, and it makes intuitive forecasting the least reliable method when used alone.
How to improve it. Pair intuitive estimates with conversation intelligence data. When Sybill captures what buyers actually said on calls, including objections, hesitations, and commitment signals, the gap between rep perception and buyer reality shrinks dramatically.
How it works. Senior leaders use their experience, market knowledge, and strategic perspective to estimate future revenue. This is common in board-level planning and annual budgeting.
When to use it. Strategic planning exercises, entering entirely new markets, or when quantitative models cannot account for known future events (regulatory changes, major product launches, economic shifts).
Where it breaks down. Executive forecasts tend to be too high (aspirational targets disguised as predictions) or disconnected from pipeline reality. They work best as a sanity check against bottom-up forecasts, not as the primary method.
How it works. A structured process where a panel of experts (internal or external) provides independent forecasts. After each round, participants see anonymized group results and revise their estimates. Over multiple iterations, the panel converges toward a consensus forecast.
When to use it. Entering new markets with no historical analogues, forecasting the impact of disruptive technology (like AI adoption), or when launching a product category that does not exist yet.
Where it breaks down. Time-consuming, expensive, and impractical for monthly or quarterly operational forecasting. Best reserved for annual strategic planning.
Quantitative methods use historical data, statistical models, and mathematical formulas to produce forecasts. They are more accurate than qualitative methods when sufficient data exists, and they scale better across larger teams.
How it works. Each deal in the pipeline is assigned a close probability based on its current stage. The forecasted value is calculated by multiplying each deal's value by its stage probability, then summing across all deals.
The formula. Forecast = Sum of (Deal Value x Stage Probability) for all deals.
Example. Three deals in pipeline: Deal A is $50,000 at Proposal stage (60% probability) = $30,000. Deal B is $20,000 at Negotiation (80%) = $16,000. Deal C is $100,000 at Qualification (20%) = $20,000. Total weighted forecast = $66,000.
When to use it. Any B2B team with a structured, multi-stage sales pipeline. This is the most commonly used method in B2B SaaS and the default in most CRMs.
Where it breaks down. It assumes that stage progression is the only indicator of deal health. A deal sitting in "Proposal" for six weeks has the same probability as one that moved there yesterday. It also relies on CRM data being accurate, which is a big assumption when reps skip updates. Tools like Sybill's CRM Autofill address this directly by keeping stage data, next steps, and qualification fields current after every call.
How to improve it. Calibrate stage probabilities against your actual historical conversion rates (not CRM defaults). Most CRMs ship with generic probabilities that do not reflect your team's real close rates by stage.
How it works. Projects future revenue by applying past growth rates to current figures. If you grew 20% quarter-over-quarter for the last four quarters, you project 20% growth for the next quarter.
The formula. Forecast = Current Period Revenue x (1 + Historical Growth Rate).
When to use it. Mature businesses with stable, predictable growth patterns and at least 12 to 24 months of clean historical data.
Where it breaks down. It assumes the future will look like the past. Market disruptions, competitive shifts, team changes, and product launches all break this assumption. It also cannot account for seasonality without additional adjustment.
How it works. Predicts when deals will close based on the average length of your sales cycle. If your average cycle is 60 days and a deal entered the pipeline 45 days ago, it is projected to close in roughly 15 days.
The formula. Average Sales Cycle = Total Days to Close All Deals / Number of Deals Closed. Projected close date for any deal = Entry Date + Average Sales Cycle Length.
When to use it. Teams with well-tracked pipeline entry dates and consistent sales cycles. Particularly useful for forecasting timing (when revenue lands) rather than amount.
Where it breaks down. It treats all deals equally. A $10,000 SMB deal and a $500,000 enterprise deal have very different cycle lengths. Segment your analysis by deal size, source, and buyer type for meaningful results.
How it works. Starts with the number of leads or opportunities at the top of the funnel and applies historical conversion rates at each stage to project revenue.
The formula. Forecast = Number of Leads x Lead-to-Opportunity Rate x Opportunity-to-Close Rate x Average Deal Size.
Example. 500 leads x 20% qualify = 100 opportunities. 100 opportunities x 25% close rate = 25 closed deals. 25 deals x $30,000 average = $750,000 forecast.
When to use it. Teams with strong top-of-funnel tracking and well-understood conversion rates. Ideal for connecting marketing spend directly to revenue projections.
Where it breaks down. Conversion rates shift based on lead source quality, market conditions, and ICP alignment. Using a single blended conversion rate hides important variation. Segment by source (inbound vs outbound vs PLG) for better accuracy.
How it works. Uses multiple variables (marketing spend, rep activity, deal velocity, stakeholder count, competitor mentions) to build a statistical model that predicts revenue. Each variable is assigned a coefficient that reflects its impact on the outcome.
The formula. Forecast = Intercept + (Coefficient1 x Variable1) + (Coefficient2 x Variable2) + ...
Example. A SaaS company's model: Revenue = $50,000 + ($500 x demos completed) + ($150 x organic MQLs) + ($2,500 x ad spend in thousands). If next quarter they plan 80 demos, 200 MQLs, and $10K ad spend: $50,000 + $40,000 + $30,000 + $25,000 = $145,000.
When to use it. Data-mature organizations with RevOps capabilities, at least 12 months of structured data, and the analytical skill to build and maintain regression models.
Where it breaks down. Requires clean, structured data across multiple systems. If your CRM data hygiene is poor, the model trains on garbage and produces garbage. Also requires periodic recalibration as market conditions shift.
How it works. Combines four variables into a single metric that measures how fast revenue moves through the pipeline: number of opportunities, average deal size, win rate, and sales cycle length.
The formula. Sales Velocity = (Number of Opportunities x Average Deal Value x Win Rate) / Average Sales Cycle Length.
Example. 50 opportunities x $25,000 average x 30% win rate / 60 days = $6,250 per day in pipeline velocity.
When to use it. Teams that want a single, actionable metric for pipeline health. Velocity reveals whether your pipeline is accelerating or decelerating, which is a leading indicator of future forecast accuracy.
Where it breaks down. It produces a rate, not a specific dollar forecast. Best used alongside weighted pipeline or regression methods rather than as a standalone forecast.
How it works. AI models analyze every signal in the deal, including conversation sentiment, email response speed, stakeholder engagement, CRM activity, and buyer behavior patterns, to produce a continuously updated probability score for each opportunity. Unlike static stage-based probabilities, AI scores change in real time as new data flows in.
When to use it. Any B2B team that wants forecast accuracy beyond what manual methods can deliver. Companies using AI-driven forecasting achieve approximately 79% accuracy compared to 51% for traditional manual methods, according to industry reviews.
How Sybill enables this. Sybill captures signals from every call, email, and CRM update. After each conversation, it extracts buyer sentiment, objections, commitment language, next steps, and stakeholder involvement, then structures this data in the CRM. Ask Sybill lets managers query their pipeline with questions like "Which deals in this quarter's commit have declining buyer engagement?" or "Which rep's pipeline has the most deals where next steps were not confirmed?" The answer is immediate and grounded in actual conversation data, not CRM stage labels.
Where it breaks down. AI forecasting is only as good as the data feeding it. If CRM fields are empty, if calls are not recorded, or if deal activity is not tracked, the model has nothing to work with. This is why CRM automation is a prerequisite for AI-driven forecasting: the data capture layer must be in place before the intelligence layer can work.
The compound advantage. AI forecasting improves over time. As the model processes more deals, it refines its understanding of what a healthy deal looks like in your specific environment. Successful strategies, rebuttals, and sales plays become part of the baseline the model uses for future predictions. This creates a flywheel: better data produces better predictions, which drive better coaching, which produces better outcomes, which feed back into the model.
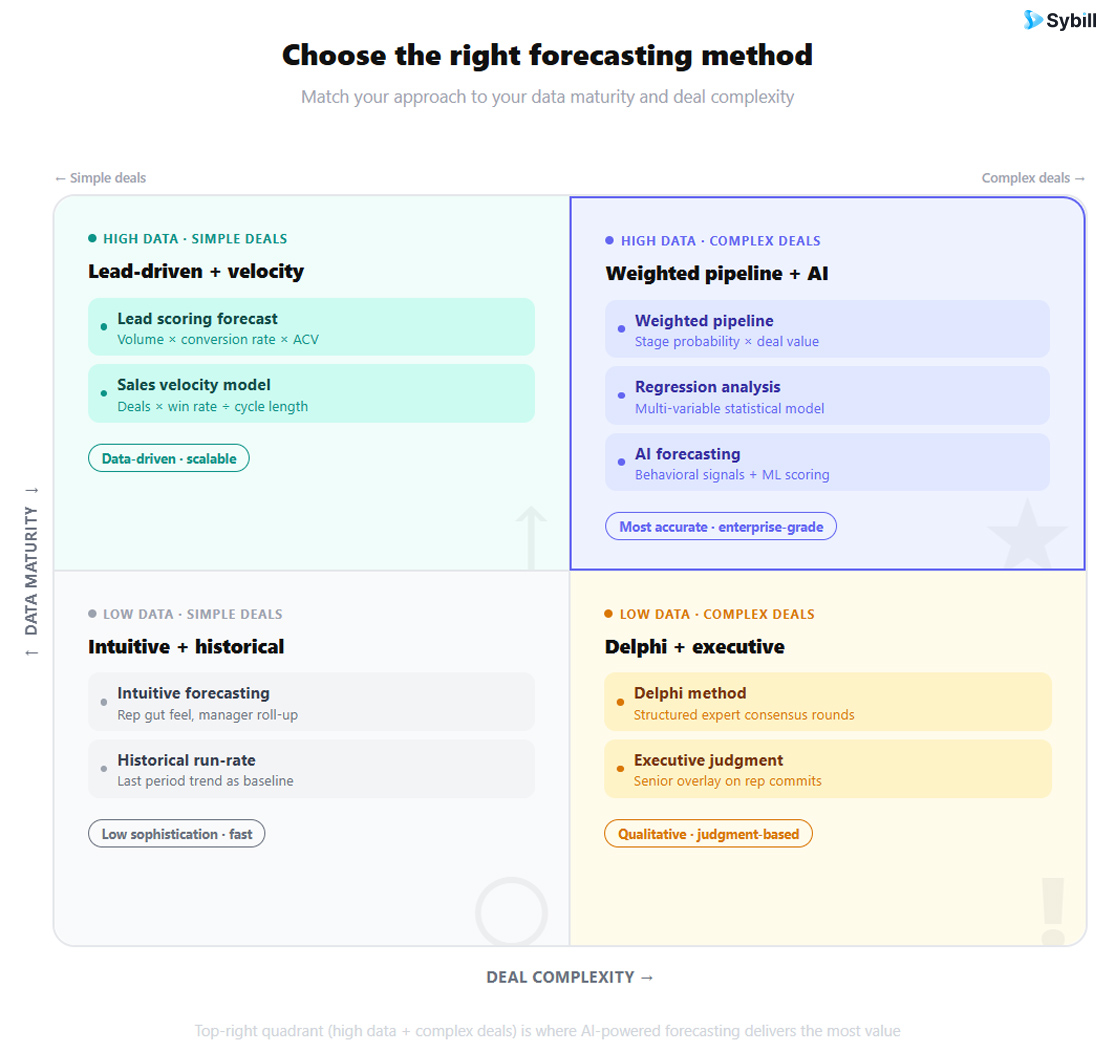
No single forecasting method works for every team. The right choice depends on four variables.
If you have less than 6 months of clean sales data, start with qualitative methods (intuitive + executive opinion) and simple quantitative methods (opportunity stage). If you have 12+ months of structured data across pipeline, activity, and conversion, you can use regression, velocity, and AI-driven approaches.
Small teams (under 10 reps) can often get accurate-enough forecasts from weighted pipeline combined with intuitive input. Larger teams need more structured methods because aggregating individual rep estimates at scale amplifies bias. AI-driven methods scale best.
Simple, high-velocity deals (short cycles, single decision-maker) work well with historical trend and lead-driven methods. Complex enterprise deals (long cycles, multiple stakeholders, buying committees) require weighted pipeline, multivariable, or AI-driven approaches that account for deal-specific variables.
If you forecast quarterly, historical trend and regression methods are sufficient. If you forecast weekly or run rolling forecasts, you need real-time methods like AI-driven deal scoring and sales velocity. The more frequently you forecast, the more you need automated data capture to keep inputs current.
The most accurate forecasts are almost always hybrids. A practical combination for most B2B SaaS teams:
Primary. Weighted pipeline (quantitative baseline) plus AI-driven deal health scoring (dynamic adjustment based on real signals).
Secondary. Sales velocity (leading indicator of pipeline momentum) plus lead-driven forecasting (connects marketing investment to pipeline).
Validation. Executive opinion and historical trends as sanity checks against the primary forecast.
This layered approach catches what any single method would miss. The weighted pipeline provides structure. AI adjusts for deal-specific reality. Velocity reveals momentum shifts. Lead-driven forecasting connects top-of-funnel investment to bottom-line revenue.
Forecasts built on incomplete, outdated, or inconsistent CRM data are unreliable by definition. If deal stages are not current, if close dates are fictional, and if qualification fields are empty, no method can produce an accurate forecast.
Fix: Automate CRM data capture. Sybill's CRM Autofill populates 30+ fields after every call, including deal stage, next steps, MEDDPICC criteria, and stakeholder roles. When CRM data reflects reality, every forecasting method immediately improves.
Reps systematically overestimate their pipeline. They hear buying signals that are not there and underweight risk indicators. This inflates the forecast and creates end-of-quarter surprises.
Fix: Use AI to provide an objective view. Conversation intelligence captures what buyers actually said, not what reps remember. When managers can see the actual sentiment, objections, and commitment level from recorded calls, the gap between perception and reality closes.
Deals that have not had activity in 14+ days sit in pipeline at full value, inflating coverage ratios and creating false confidence.
Fix: Implement automated staleness alerts. Flag any deal without logged activity in the last two weeks and require reps to either update the deal with new information or move it to a lower-confidence category. Pipeline reviews should start with stale deal cleanup before discussing strategy.
Every method has blind spots. Stage-based forecasting ignores deal health. Historical trends ignore current pipeline. Intuitive forecasting ignores data. Using only one method guarantees those blind spots affect your number.
Fix: Layer methods as described in the decision framework above. Use at least a primary quantitative method plus AI-driven adjustment plus a qualitative sanity check.
A quarterly forecast is a snapshot that is stale within days. By mid-quarter, the pipeline looks nothing like it did on forecast day.
Fix: Move to rolling weekly forecasts. AI-driven tools make this practical because the data updates automatically. Sybill's deal health scores update continuously from real buyer signals, so your forecast reflects this week's reality, not last month's.
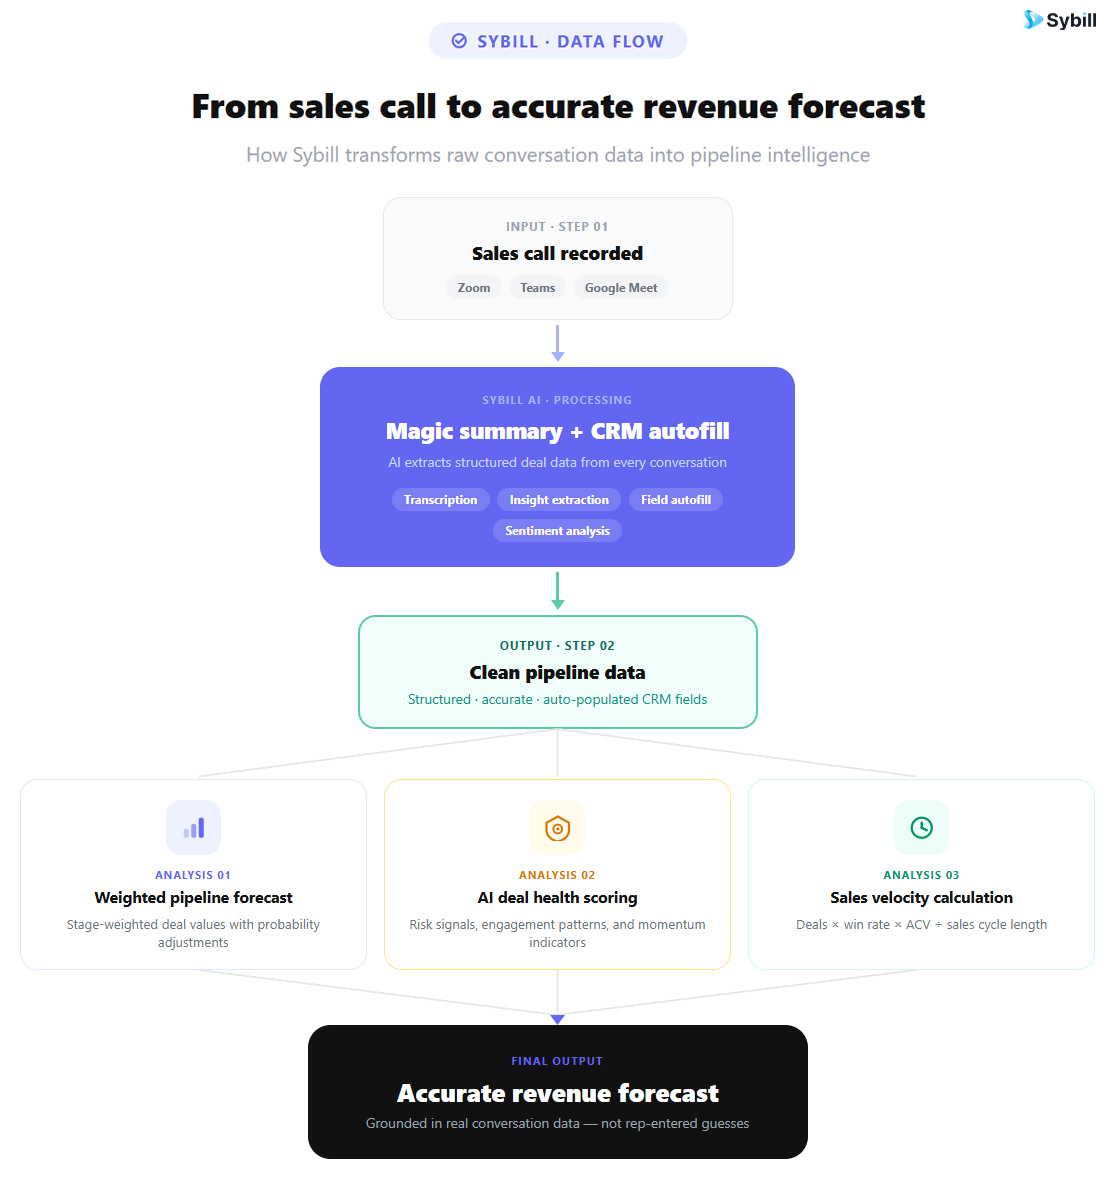
The single biggest lever for forecasting accuracy is data quality. Every method, from simple weighted pipeline to sophisticated AI models, improves when the data feeding it is complete, current, and accurate.
Sybill addresses this at the source.
After every call: Magic Summaries capture what was discussed, decided, and committed. CRM Autofill updates 30+ fields with structured data including deal stage, close date, next steps, qualification criteria, pain points, objections, and stakeholder roles.
Across the pipeline: Ask Sybill answers manager questions like "Which deals have no confirmed next steps?" or "Where are we single-threaded in commit?" instantly, with evidence from actual conversations. This turns pipeline reviews from interrogations into strategy sessions.
For coaching: AI surfaces which reps have the weakest discovery depth, which consistently struggle with objection handling, and where follow-up speed is lagging. Coaching becomes precise, not generic, which improves win rates, which improves forecast accuracy.
For forecasting: When every CRM field is reliably populated, weighted pipeline calculations actually work. When buyer sentiment is captured from calls, AI-driven deal scoring has the signals it needs. When stale deals are flagged by activity data, pipeline coverage ratios reflect reality. The forecast becomes an output of a clean system, not a guess built on hope.
What is the most accurate sales forecasting method?
The most accurate forecasting approach combines multiple methods. A weighted pipeline provides the quantitative baseline, AI-driven deal health scoring adjusts for real-time buyer signals, and historical trends plus executive judgment serve as sanity checks. Companies using AI-driven forecasting achieve approximately 79% accuracy compared to 51% for manual methods. No single method is sufficient on its own because each has blind spots that complementary methods cover.
What is the difference between qualitative and quantitative forecasting?
Qualitative forecasting relies on human judgment, expert opinion, and subjective assessment. It is most useful when historical data is limited. Quantitative forecasting uses historical data, statistical models, and mathematical formulas. It is more accurate when sufficient data exists. The best forecasting programs blend both: quantitative models provide the baseline, and qualitative inputs adjust for factors that historical data cannot capture.
How do I choose the right forecasting method for my team?
Evaluate four factors: data maturity (how much clean historical data you have), team size (smaller teams can use simpler methods), deal complexity (complex enterprise deals need more sophisticated approaches), and forecasting cadence (weekly rolling forecasts require automated data capture). Most B2B SaaS teams benefit from starting with weighted pipeline forecasting and layering in AI-driven deal scoring as data maturity increases.
What is weighted pipeline forecasting?
Weighted pipeline forecasting assigns a close probability to each deal based on its current sales stage, then multiplies the deal value by that probability to produce a weighted forecast. The formula is: Forecast = Sum of (Deal Value x Stage Probability) for all deals. It is the most commonly used method in B2B SaaS but requires calibrated stage probabilities based on actual historical close rates, not CRM defaults.
How does AI improve sales forecasting accuracy?
AI improves forecasting by analyzing signals that manual methods cannot process: conversation sentiment, email response patterns, stakeholder engagement, buyer behavior, and deal velocity. Unlike static stage-based probabilities, AI scores update continuously as new data flows in. Sybill enables this by automatically capturing structured deal data from every conversation and populating CRM fields in real time, giving AI models the clean, current inputs they need.
What is sales velocity and how is it used in forecasting?
Sales velocity measures how fast revenue moves through the pipeline using four variables: number of opportunities, average deal value, win rate, and sales cycle length. The formula is: Velocity = (Opportunities x Deal Value x Win Rate) / Cycle Length. It produces a rate (revenue per day) rather than a dollar forecast, making it a leading indicator of pipeline momentum rather than a standalone forecast method. Best used alongside weighted pipeline or AI-driven approaches.
How often should I update my sales forecast?
Weekly is the recommended minimum for operational forecasting. Monthly or quarterly is sufficient for strategic planning. The more frequently you forecast, the more important automated data capture becomes. AI-driven tools like Sybill enable continuous forecasting by updating deal health scores and CRM data in real time, so your forecast always reflects current pipeline reality rather than a stale snapshot.
Sales forecasting is not about predicting the future perfectly. It is about building a system where the prediction gets better over time because the data gets cleaner, the methods get more appropriate, and the team gets more disciplined about using both.
The method matters. But the data underneath the method matters more. Teams that automate CRM data capture, capture buyer signals from actual conversations, and layer multiple forecasting approaches produce forecasts that leadership can trust and act on.
Sybill handles the data foundation. It keeps CRM fields current, captures deal intelligence from every interaction, and gives managers the real-time pipeline visibility that every forecasting method depends on.
Get started for free with Sybill and build forecasts your board actually believes.
The most accurate forecasting approach combines multiple methods. A weighted pipeline provides the quantitative baseline, AI-driven deal health scoring adjusts for real-time buyer signals, and historical trends plus executive judgment serve as sanity checks. Companies using AI-driven forecasting achieve approximately 79% accuracy compared to 51% for manual methods. No single method is sufficient on its own because each has blind spots that complementary methods cover.
Qualitative forecasting relies on human judgment, expert opinion, and subjective assessment. It is most useful when historical data is limited. Quantitative forecasting uses historical data, statistical models, and mathematical formulas. It is more accurate when sufficient data exists. The best forecasting programs blend both: quantitative models provide the baseline, and qualitative inputs adjust for factors that historical data cannot capture.
Evaluate four factors: data maturity (how much clean historical data you have), team size (smaller teams can use simpler methods), deal complexity (complex enterprise deals need more sophisticated approaches), and forecasting cadence (weekly rolling forecasts require automated data capture). Most B2B SaaS teams benefit from starting with weighted pipeline forecasting and layering in AI-driven deal scoring as data maturity increases.