Find us at booth #83, join us for a harbor side happy hour, or catch Gorish’s talk.

Sept, 16-18 > Learn more

%20(1).avif)
Mamta Tainwala

July 22, 2026
%20(47).png)
Neither pipeline growth nor close rate is universally more important: revenue is their product, not their sum. Pipeline velocity = (opportunities × win rate × average deal size) ÷ sales cycle length, so the right focus is whichever multiplier is currently weakest. That said, the most common failure mode by far is chasing pipeline volume while close rate quietly rots, because volume is easier to manufacture and nicer to report.
The math, the traps, and how to run both levers without wrecking either, below.
A pipeline increase is growth in the total number or value of open opportunities in your funnel. It is a healthy signal only when qualification standards held constant while volume grew. When the increase comes from loosened standards, delayed disqualification, or stalled deals nobody closed out, it is pipeline bloat: a bigger number hiding a weaker engine.
Pipeline growth is the most celebrated metric in sales because it is the easiest to manufacture. Accept every MQL, rush discovery, keep dead deals open, and congratulations, the dashboard is up and to the right. Investors smile. The Monday meeting feels great.
But guess what? None of those deals got more likely to close. Your reps just got more places to lose.
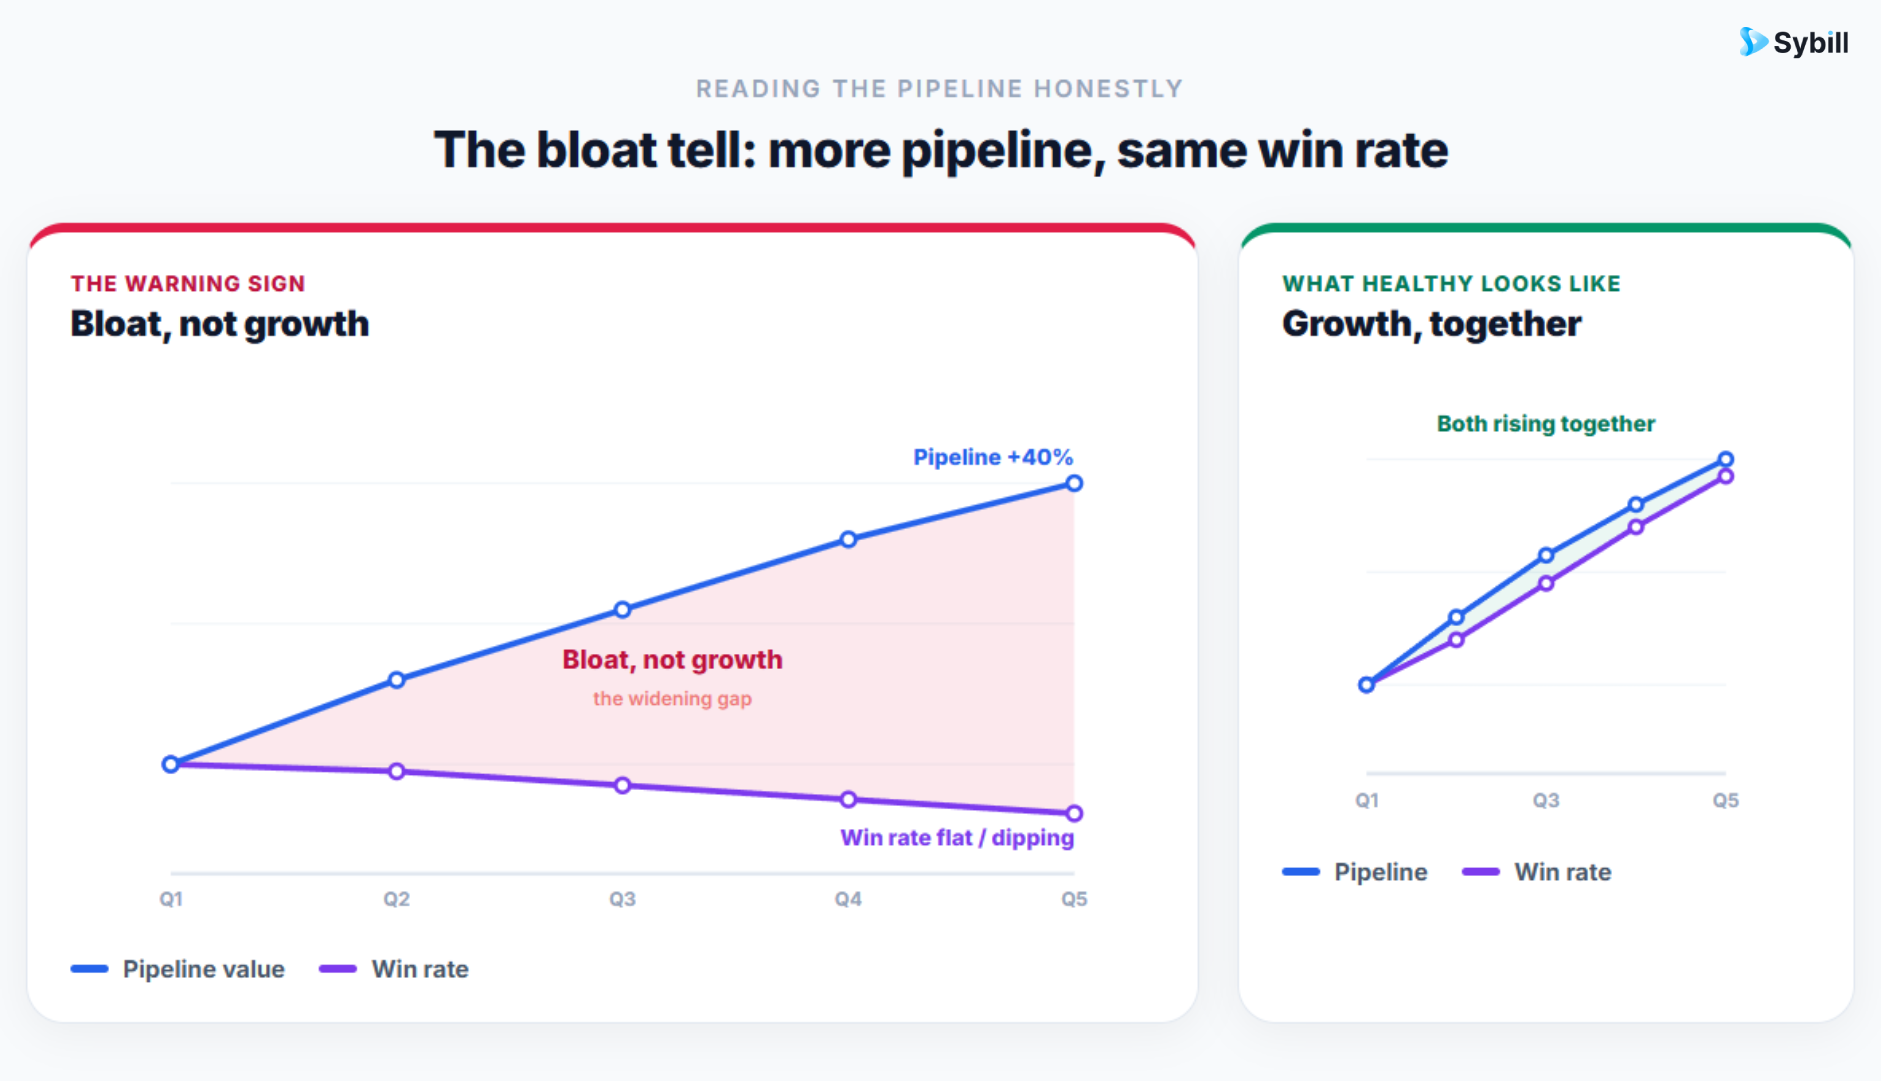
The tell is simple: did close rate hold while pipeline grew? If pipeline is up 40% and win rate is flat or falling, you did not generate more opportunity. You generated more noise, and noise has a real cost: rep attention spread across dead-end deals, forecasts built on fiction, and the genuinely winnable opportunities buried under maybes. Real pipeline generation grows the funnel with deals that pass the same qualification bar as before. Anything else is inventory inflation.
Close rate (also called win rate) is the%age of opportunities that end in closed-won: deals won ÷ total closed deals × 100. Closing 16 of 40 decided deals is a 40% close rate. It measures the efficiency of everything after qualification: discovery quality, objection handling, multithreading, and urgency creation.
Two reps, same quota, to make it concrete:
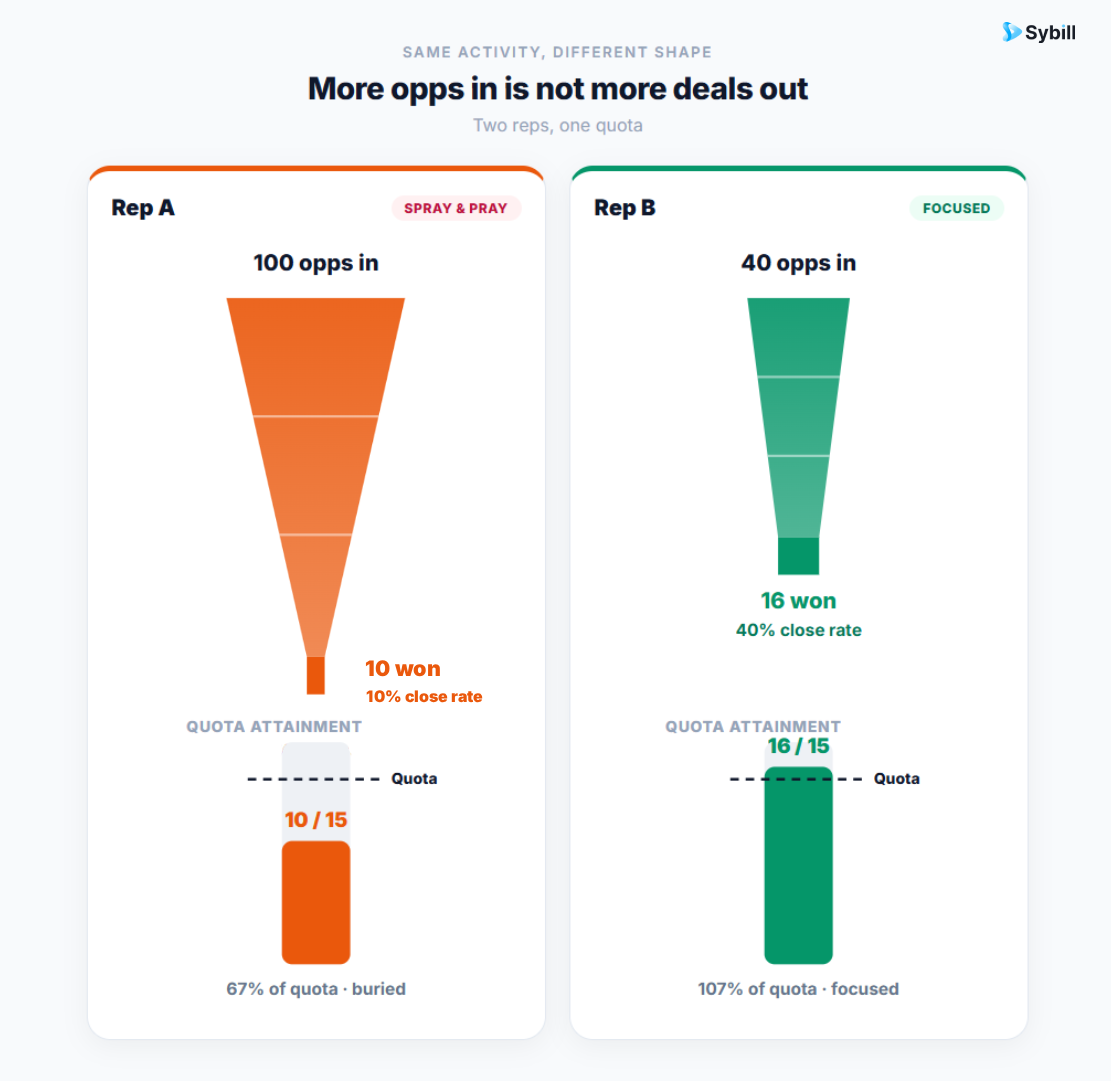
Rep A carries 100 opportunities and closes 10. Ten% close rate. Busy, buried, forecasting by hope.
Rep B carries 40 opportunities and closes 16. Forty% close rate. Fewer plates spinning, more of them landing.
Rep B is not four times more talented. Rep B is running a qualified pipeline and giving each real deal the attention it needs, while Rep A is paying an attention tax on 90 deals that were never going to happen. Close rate is where that difference becomes visible, which is why it is the metric most correlated with how a team actually sells, not just how hard it prospects.
One honest caveat before anyone weaponizes this in a QBR: close rate is gameable too. Sandbag the pipeline, only log deals that are basically won, and your close rate looks Olympic while your revenue stays flat. Which is exactly why neither metric works alone, why segmented win rates should feed your win-loss analysis rather than a leaderboard, and why the next section is the actual answer to this post's question.
The pipeline velocity equation answers this per team, not universally: velocity = (number of opportunities × win rate × average deal value) ÷ sales cycle length. Because the terms multiply, improving your weakest one yields the most revenue. A team at 3x coverage with a 15% win rate should fix conversion; a team winning 35% of a thin pipeline should generate.
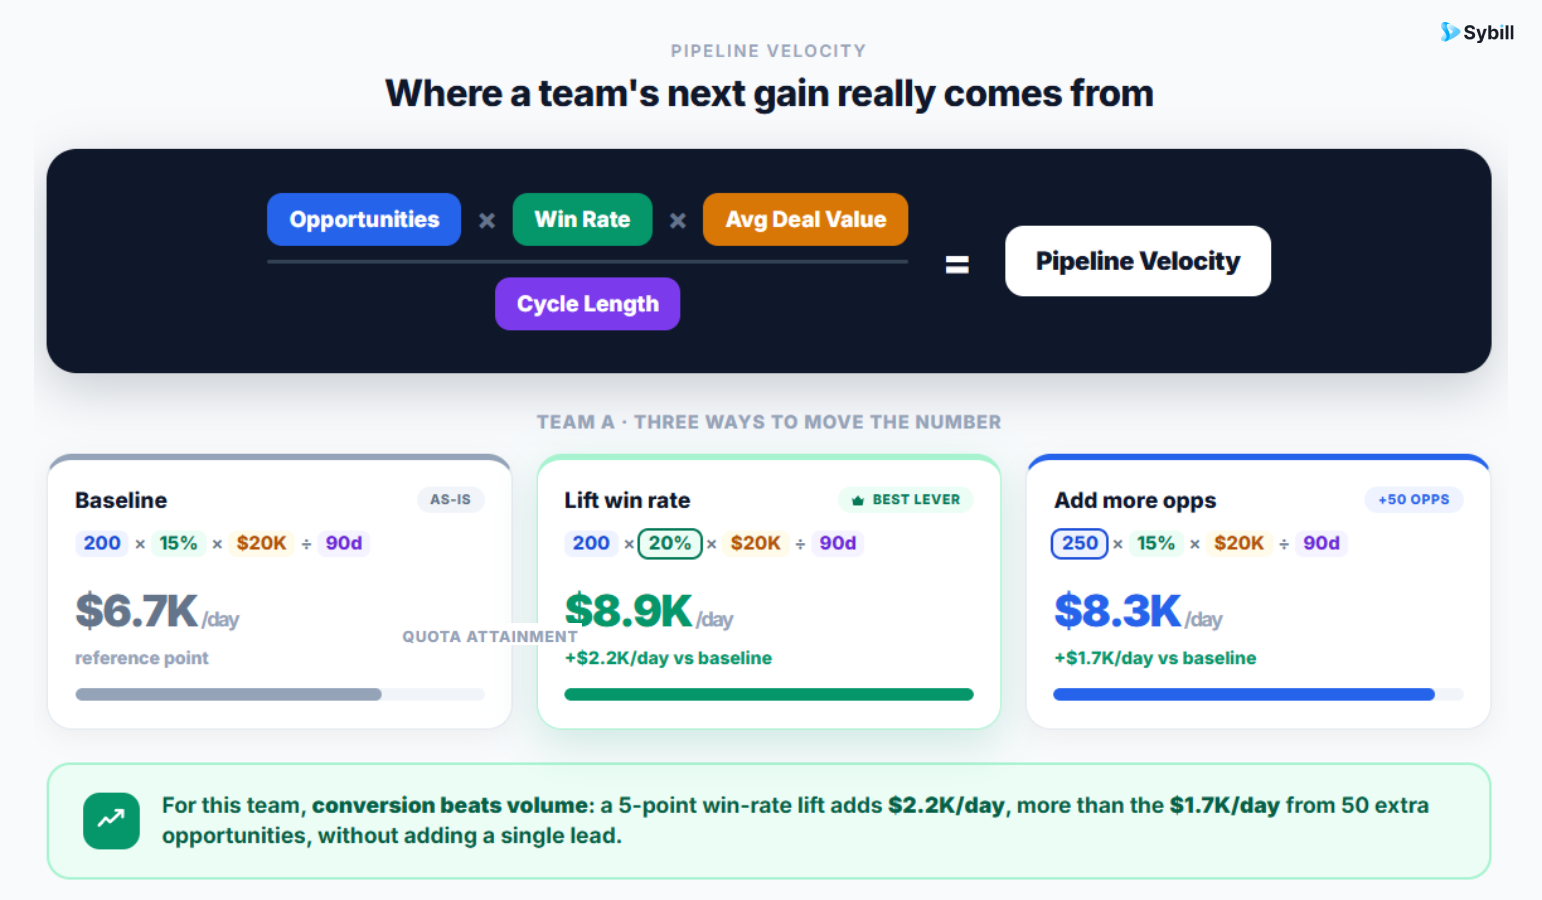
Run the worked example, because this is where the debate stops being philosophical:
A team has 200 opportunities, a 15% win rate, $20,000 average deal size, and a 90-day cycle. Velocity: (200 × 0.15 × 20,000) ÷ 90 = $6,667 of revenue per day.
Option one, chase volume: add 50 more opportunities at the same win rate. New velocity: $8,333 per day. But those 50 opportunities cost prospecting hours, and if they came from loosened qualification, the blended win rate drops and eats the gain.
Option two, fix conversion: raise win rate from 15 to 20% through better qualification and coaching. New velocity: $8,889 per day. From the same pipeline. No new prospecting cost, and the improvement compounds into every future deal that enters the funnel.
For this team, five points of win rate beat fifty new deals. For a team already winning 35% with thin coverage, the math flips, and volume is exactly right. That is the whole answer: the equation does not care about your philosophy. It cares about your weakest multiplier. Check your coverage ratio against your real win rate, find the soft term, and point the quarter at it.
And note what the denominator quietly adds to the debate: cycle length is the forgotten third lever. A team that cuts its cycle from 90 to 75 days gets a 20% velocity gain nobody was even arguing about.
Three structural reasons: volume is easier to manufacture than conversion (activity is controllable, wins are not), incentives reward top-of-funnel motion (meetings booked, opportunities created), and pipeline growth photographs better in board decks than a win rate that moved two points. The bias is organizational, not individual, which is why fixing it requires changing what gets measured and paid.
Let us be adults for a second about the incentive structure, because blaming reps for pipeline bloat is diagnosing the symptom. If comp plans pay on opportunities created, reps will create opportunities. If Monday meetings celebrate pipeline adds and skip conversion trends, the team optimizes for adds. If disqualifying a deal reads as failure in the CRM, deals stay open until they fossilize.
The fixes are equally structural:
Make disqualification a celebrated stat. Fast, well-reasoned disqualification is a conversion skill. Track it, praise it, and mine the patterns: what should never have entered the funnel teaches you as much as what closed.
Review conversion in the same meeting as coverage. Pipeline reviews that only inspect volume get volume. Put stage-to-stage conversion and win rate trends on the same pipeline view the team already looks at weekly, and let the same numbers flow into forecast prep so nobody maintains two versions of the truth.
Pay for quality signals. Blend comp and recognition toward close rate improvement, cycle reduction, and forecast accuracy, not just top-of-funnel motion. What gets rewarded gets repeated, and sales leaders set that market. Your team has targets, not vibes, and the targets should point at revenue, not activity.
Close rate lives in your conversations. Sybill shows you what actually happened in every deal: engagement, objections, risks, and next steps, so you coach conversion instead of counting activity. Try it for free.
Five tactics run both levers at once: qualify ruthlessly with a consistent framework, verify qualification against conversation evidence instead of rep optimism, coach the deals rather than the activity counts, keep the CRM clean enough that priorities are visible, and automate admin so the hours saved go back into prospecting. Quality and volume compete for attention, not for possibility.
1. Qualify fast, disqualify faster. Pick a qualification framework and enforce it at the funnel's front door. Every unqualified deal kept out is rep attention returned to a winnable one.
2. Verify qualification with evidence, not optimism. Reps say the deal is qualified. The calls know. Deal inspection checks whether the economic buyer actually engaged, next steps were actually confirmed, and objections were actually resolved, against the conversation record. This is the single fastest way to deflate a bloated pipeline into an honest one.
3. Coach the conversion moments. Activity coaching ("make more calls") raises the numerator of nothing. Conversion coaching reviews the calls where momentum died: the unhandled objection, the missed closing cue, the demo that ran long and said little. That is where win rate points hide, and AI-assisted coaching finds those moments across every rep instead of the two calls a manager had time to join.
4. Read the buyer, not just the stage field. Stage says "proposal sent." The buyer's questions, urgency, and engagement across calls say whether it will sign. Buyer intelligence surfaces which deals show real intent, so reps advance the live ones and stop watering the plastic plants. Sybill has analyzed millions of sales conversations, and deals with genuine buying signals in the conversation record close at a rate the stage field simply cannot predict.
5. Automate the admin, reinvest the hours. Here is the resolution to the whole quantity-quality tension: it is an attention conflict, and attention can be manufactured. When CRM updates, follow-up emails, and task tracking run themselves, account executives get hours back weekly. Spend those hours on prospecting and the pipeline grows. Spend them on live deals and close rate climbs. Either way, the equation wins.
The pipeline-versus-close-rate debate survives because both sides are half right and nobody does the math. Volume advocates are right that you cannot close what you never opened. Conversion advocates are right that a bloated funnel is a slower way to miss quota. The velocity equation ends the argument: multiply the terms, find the weak one, fix it, repeat next quarter.
What the equation cannot do is tell you the truth about your own pipeline, because that truth lives in conversations: which deals are real, which buyers are engaged, which "qualified" opportunities were optimism with a close date. That layer is Sybill's job. Evidence in, honest pipeline out, and every admin hour returned to whichever lever your math says needs it.
Fill the funnel or fix the funnel: with your evenings back, you CAN do both.
Start free or book a demo and let the math meet the evidence.
Most B2B teams close between 15 and 30% of qualified opportunities, with wide variance by industry, deal size, and how strictly "qualified" is defined. A team with loose qualification will show a lower rate on more volume. Track your own trend by segment rather than chasing a universal benchmark.
Pipeline velocity = (number of qualified opportunities × win rate × average deal value) ÷ sales cycle length in days. The output is revenue per day. Because the terms multiply, small improvements to any one of them, including shortening the cycle, compound into meaningful velocity gains.
They are two views of the same requirement: coverage needed is roughly the inverse of win rate. A 25% win rate demands about 4x pipeline coverage; a 33% rate needs 3x. Teams should check coverage weekly against their actual win rate, not against a generic 3x rule.
Almost always pipeline bloat: opportunities entering without passing a consistent qualification bar, stalled deals staying open, or close dates slipping quarter to quarter. Check whether win rate declined as pipeline grew, and audit open deals against conversation evidence of real buyer engagement.
Better deals, up to the coverage your win rate requires, then more deals. A rep's attention is the scarcest resource in the funnel, and spreading it across unqualified opportunities lowers the close rate on the real ones. Automating admin work expands the attention budget for both.
Most B2B teams close between 15 and 30% of qualified opportunities, with wide variance by industry, deal size, and how strictly "qualified" is defined. A team with loose qualification will show a lower rate on more volume. Track your own trend by segment rather than chasing a universal benchmark.
Pipeline velocity = (number of qualified opportunities × win rate × average deal value) ÷ sales cycle length in days. The output is revenue per day. Because the terms multiply, small improvements to any one of them, including shortening the cycle, compound into meaningful velocity gains.
They are two views of the same requirement: coverage needed is roughly the inverse of win rate. A 25% win rate demands about 4x pipeline coverage; a 33% rate needs 3x. Teams should check coverage weekly against their actual win rate, not against a generic 3x rule.