Find us at booth #83, join us for a harbor side happy hour, or catch Gorish’s talk.

Sept, 16-18 > Learn more

%20(1).avif)
Mamta Tainwala

July 24, 2026
%20(51).png)
Top-down forecasting starts with market size and works down: total addressable market × target share = revenue projection. Bottom-up forecasting builds from your pipeline up: deals × stage-weighted win rates, aggregated across reps. Top-down suits planning, new markets, and target-setting; bottom-up suits operational quarterly forecasts. Mature teams run both and treat the gap between them as the most useful number either produces.
The definitions take two minutes. The judgment (which one, for which decision, and what to do when they disagree) is the rest of this guide.
Top-down forecasting derives revenue from market-level data: estimate the total addressable market, narrow to the serviceable segment, apply a target market share, and allocate the result down into regional or team targets. It answers "how big could this be?" and is the default for new markets, long horizons, annual planning, and investor conversations.
The mechanics, in one worked line: if your serviceable addressable market is $200 million and you target 2% share, top-down says $4 million. Divide that into territories and quarters, and you have a plan.
Notice what the method never asked: whether your team, pipeline, and cycle lengths can actually produce $4 million. That is not a flaw; it is the design. Top-down is deliberately unconstrained by your execution, the same way demand forecasting is unconstrained by your capacity. Its job is sizing the opportunity, not predicting the quarter.
Which is why its strengths and weaknesses are two sides of one coin. Strengths: fast to build, strategic by construction, usable before you have any sales history, and legible to boards and investors who think in markets. Weaknesses: every number rests on share assumptions nobody can verify in advance, it cannot see pipeline health or execution constraints, and it produces the most dangerous artifact in sales planning: a confident target with no mechanism attached. Ask any team handed a "3% of the market" quota derived in a boardroom how the mechanism part went.
Bottom-up forecasting aggregates upward from deal-level reality: each rep's pipeline, weighted by stage conversion rates and adjusted for cycle length, rolls into team, regional, and company projections. It answers "what will we actually close this period?" and is the standard method for operational quarterly and monthly forecasts.
The build sequence: reps assess their opportunities, managers review and pressure-test the roll-up, ops consolidates across teams and segments, leadership finalizes. Every dollar in the forecast traces to a named deal, which is the method's superpower: when the number moves, you can ask which deals moved it, and someone owns the answer.
Its strengths follow directly: granular accuracy on near-term revenue, accountability at every level, and diagnostic power (a weak forecast decomposes into specific stages, segments, and reps you can act on). Its weaknesses are equally structural, and worth stating without euphemism:
It inherits your CRM's fiction. Bottom-up math is only as honest as the stage fields and close dates feeding it, and those have traditionally reflected rep optimism more than deal reality. Garbage in, confident garbage out.
It cannot see the market. A perfectly aggregated pipeline says nothing about the demand shift, competitor launch, or budget freeze arriving next quarter. Bottom-up looks down at deals, never up at conditions.
It is expensive. Pipeline reviews, roll-up meetings, data hygiene: the method consumes real hours every cycle, which is precisely why so many teams run it badly rather than not at all.
The first weakness is the one that has actually changed since this post was originally written, and we will get to that. The second is permanent, and it is why bottom-up needs a top-down counterweight.
The core differences: top-down starts from market size, bottom-up from deal data; top-down serves planning and target-setting on annual-plus horizons, bottom-up serves operational forecasts on monthly and quarterly horizons; top-down is fast but assumption-dependent, bottom-up is accurate but data-quality-dependent; top-down is owned by leadership and finance, bottom-up by sales management and RevOps.
The row that matters most is failure mode, because it is what the methods look like when misapplied:
Top-down failure: targets divorced from capacity. The board-approved number flows downhill into quotas that no amount of pipeline math supports, morale erodes, and by Q3 everyone quietly knows the plan was fiction with a font.
Bottom-up failure: precision about the wrong world. The roll-up is beautiful, every deal weighted to two decimals, and the whole edifice misses because the market moved and no deal-level view could see it coming.
Same disease in both cases: one lens doing a job built for the other.
Run both methods on one company and the gap between the answers becomes the insight. A team whose top-down math supports $4M but whose bottom-up pipeline supports $3.1M does not have a forecasting problem; it has a $900K question with exactly three possible answers: generate more pipeline, improve conversion, or revise the target.
The worked example, concretely:
Top-down: SAM of $200M, target share of 2% → $4.0M for the year.
Bottom-up: 8 reps carrying $2.5M of qualified pipeline per quarter at a 28% blended win rate, plus renewals → roughly $3.1M annualized.
Now picture this: most companies compute one of these numbers, and whichever one they compute, they believe. The top-down believers set a $4M quota and spend the year blaming execution. The bottom-up believers forecast $3.1M and never ask whether the market supported more.
The mature move is to compute both and interrogate the $900K:
The gap is not an embarrassment to reconcile away. It is the single most decision-rich number in your planning cycle, and only teams running both methods ever get to see it. There is genuine room for improvement here across the industry: Gartner reported back in 2020 that fewer than half of sales leaders had high confidence in their forecasting accuracy, and single-method forecasting is a big reason why.
Bottom-up is only as honest as the deal data underneath it. Sybill grounds every pipeline number in what buyers actually said: real stages, real risks, real next steps. Get started for free with Sybill.
Use top-down for annual planning, new market entry, fundraising narratives, and any horizon beyond your pipeline's visibility. Use bottom-up for the quarterly and monthly operating forecast, quota validation, and any number leadership will be held to. Use both, reconciled, whenever targets are being set, which is the one moment the methods must meet.
The decision guide, by situation rather than by ideology:
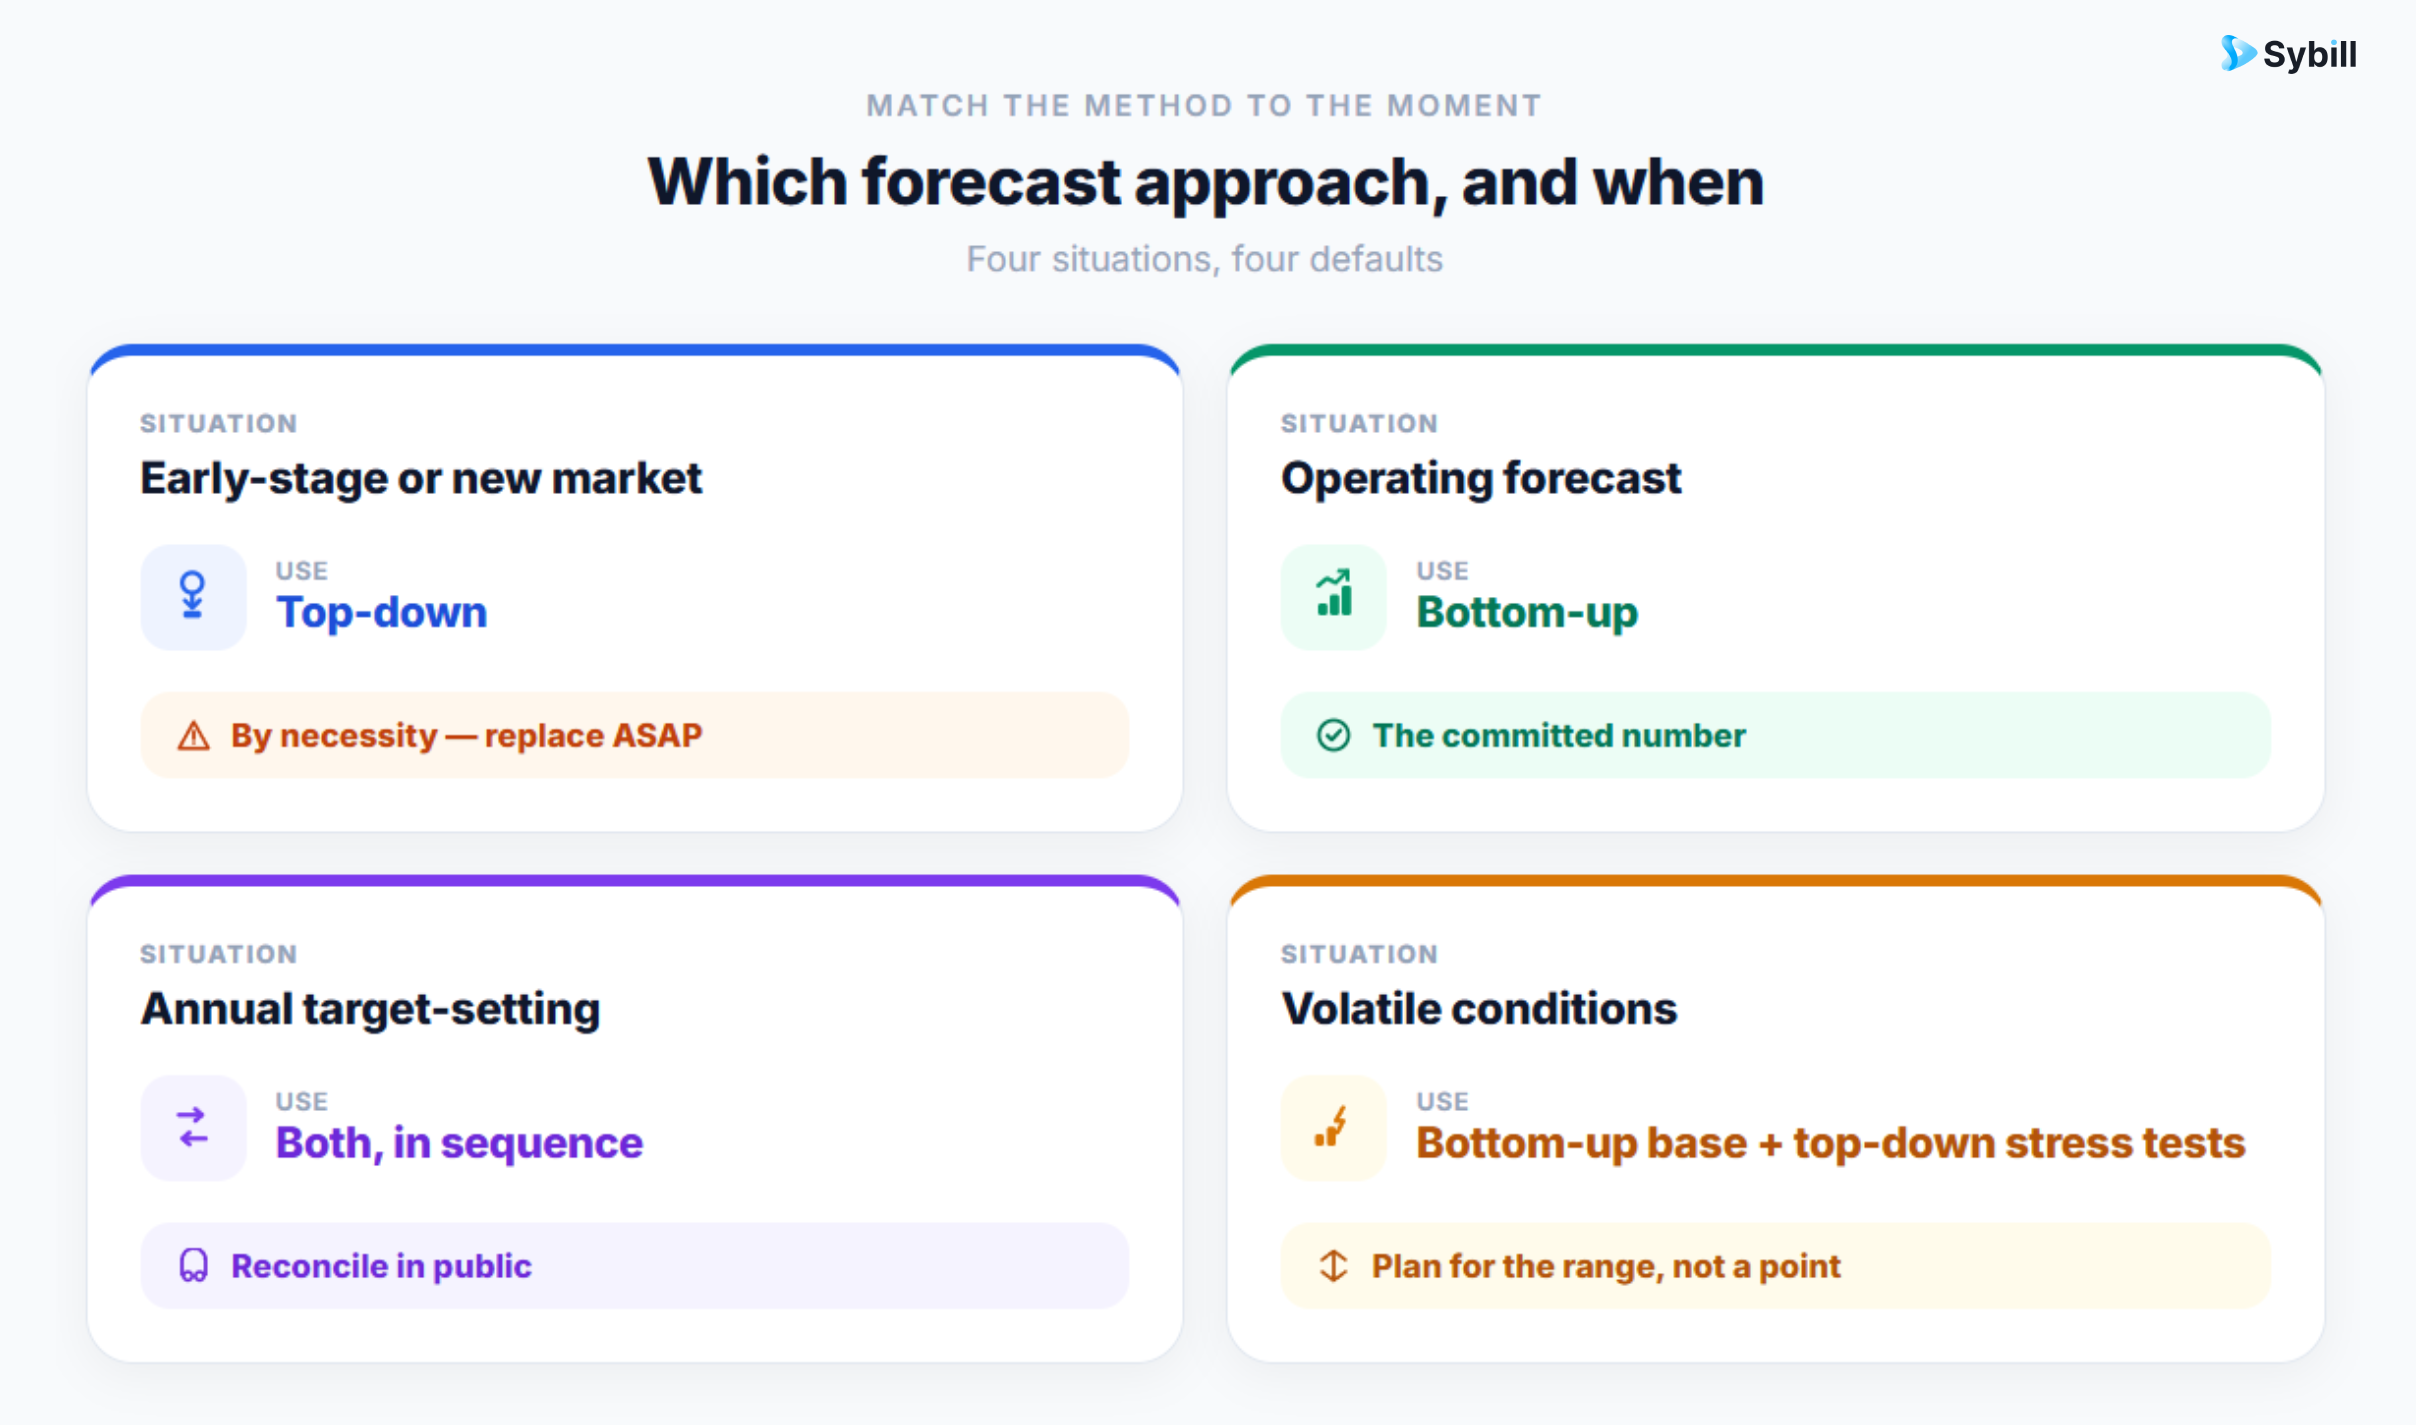
Early-stage or entering a new market: top-down first, by necessity. You have no pipeline history to aggregate, so market math is the only math available. Just label its confidence honestly and replace it with bottom-up the moment real pipeline data exists.
Established motion, operating forecast: bottom-up, full stop. The number you commit to the board each quarter should trace to named deals with evidence behind them, reviewed in a forecast call built on that evidence.
Annual target-setting: both, in sequence. Top-down proposes what the market supports; bottom-up validates what the team can produce; the gap gets negotiated in the open with its closure plan attached. Targets set by only one method are either uninformed by the market or unconstrained by reality, and both varieties get missed.
Volatile conditions: run bottom-up as the base and stress-test with top-down scenarios, since market shocks show up in TAM-level thinking before they show up in your pipeline. Pair it with the scenario-range discipline from our forecast accuracy guide and volatility becomes something you planned for rather than something that happened to you.
And whatever the situation, one hygiene rule: never let a top-down number silently overwrite a bottom-up forecast in the CRM or the board deck. When leadership "adjusts" the roll-up to match the plan, the company loses its only honest instrument. Keep both numbers visible; reconcile in public.
AI upgrades both methods but transforms bottom-up, because bottom-up's historic weakness (forecasts built on rep optimism and stale CRM fields) is now fixable. Conversation intelligence grounds deal data in evidence, AI scoring weights pipeline on buyer behavior rather than stage labels, and the freshest market signal for top-down assumptions turns out to be what buyers say on calls.
The specifics, method by method:
Bottom-up gets an evidence layer. The classic knock on bottom-up was that its precision was fake: two-decimal probabilities resting on whatever stage a rep picked. That era is ending. Deal inspection verifies deals against what actually happened in conversations (economic buyer engaged or not, next steps confirmed or not, pricing objection resolved or not), CRM autofill keeps the substrate current without rep discipline, and predictive scoring weights the roll-up on behavior instead of hope. RevOps teams running this stack get bottom-up forecasts that deserve their decimal points, and a single source of deal truth means the roll-up and the deal narratives never diverge.
Top-down gets a leading indicator. Market assumptions traditionally refresh annually, from analyst reports describing last year. Meanwhile, your team's calls contain this month's market: which competitors are surfacing, what budget language sounds like, which use cases are suddenly in every discovery conversation. Buyer intelligence and competitor tracking across the call base turn that into structured signal, and Ask Sybill makes it queryable: "What are prospects saying about budgets for next year?" is a top-down assumption check with a same-day answer. Sybill has analyzed over 33 Million sales conversations, and shifts in buyer language consistently front-run the market data that top-down models wait for.
The reconciliation gets faster. When both methods run on shared, current data, the gap analysis stops being a quarterly offsite exercise and becomes a standing view for sales leaders: here is what the market math supports, here is what the evidence-weighted pipeline supports, here is this week's gap and its trend.
For the broader toolbox around both methods, our guides to forecasting methods and forecasting tools go deeper.
The top-down versus bottom-up debate is a category error dressed up as a strategy question. They are not competing answers to one question; they are correct answers to two different questions, and every company old enough to have a pipeline needs both: the market lens to set direction, the deal lens to commit numbers, and the discipline to make them argue in public every planning cycle.
The teams that forecast well are not the ones that chose the right method. They are the ones that compute both, name the gap, and assign it an owner before the quarter starts, instead of discovering it in the quarter-end post-mortem.
The gap analysis is yours to run. The evidence underneath it, honest deal data on the bottom-up side and live buyer signal on the top-down side, is what Sybill keeps flowing while your team sells.
Get started for free with Sybill or book a demo and give both forecasts the same source of truth.
Bottom-up is more accurate for near-term operational forecasts, because it builds from real deals with real evidence. Top-down is more useful for long horizons and new markets where no pipeline history exists. Accuracy comparisons between them mostly miss the point: they answer different questions on different horizons.
Yes, and mature revenue teams should. The standard pattern: top-down proposes targets from market math, bottom-up validates them against pipeline capacity, and the gap between the two numbers gets an explicit closure plan (more pipeline, better conversion, or a revised target) before quotas are finalized.
A company sizes its serviceable addressable market at $200 million and targets 2% share, producing a $4 million revenue projection, which is then allocated into regional and quarterly targets. The strength is speed and strategic framing; the risk is that share assumptions carry no execution mechanism.
Deal-level pipeline data: opportunity values, stages with consistent exit criteria, historical stage-to-stage conversion rates, sales cycle lengths, and close dates. Accuracy depends entirely on this data reflecting reality, which is why conversation-verified deal records and automated CRM hygiene have become the method's biggest upgrades.
Usually because share assumptions substitute for execution planning: "capture 3% of the market" carries no mechanism for pipeline, headcount, or conversion. Top-down numbers fail safely when treated as sizing exercises and dangerously when handed down as quotas without bottom-up validation.
Bottom-up is more accurate for near-term operational forecasts, because it builds from real deals with real evidence. Top-down is more useful for long horizons and new markets where no pipeline history exists. Accuracy comparisons between them mostly miss the point: they answer different questions on different horizons.
Yes, and mature revenue teams should. The standard pattern: top-down proposes targets from market math, bottom-up validates them against pipeline capacity, and the gap between the two numbers gets an explicit closure plan (more pipeline, better conversion, or a revised target) before quotas are finalized.
A company sizes its serviceable addressable market at $200 million and targets 2% share, producing a $4 million revenue projection, which is then allocated into regional and quarterly targets. The strength is speed and strategic framing; the risk is that share assumptions carry no execution mechanism.