Find us at booth #83, join us for a harbor side happy hour, or catch Gorish’s talk.

Sept, 16-18 > Learn more


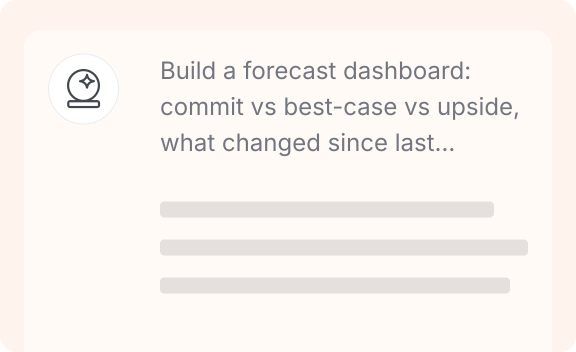
A recurring forecast roll-up: commit vs best-case vs upside, what changed since last week, and where the risk sits.
Put this prompt to work in Sybill.
Build a forecast dashboard: commit vs best-case vs upside, what changed since last week, and where the risk sits, with a table of the deals moving the number.
Base the categories on real activity rather than optimism, and flag the deals at risk.
Here's what Sybill hands back.

Write your email like a top Account Executive.
Get smarter with every deal.