Find us at booth #83, join us for a harbor side happy hour, or catch Gorish’s talk.

Sept, 16-18 > Learn more

%20(1).avif)
Mamta Tainwala

September 5, 2026
%20(86).png)
TL;DR: Choosing sales dashboard software is not really a tool decision. It is a data decision and a resources decision wearing a tool costume. Native CRM dashboards win when your questions are simple and your data lives in one place. BI platforms win when you have an analyst and cross-system questions. Plug-and-play dashboard tools win when you want visuals fast without BI overhead. And AI-generated dashboards win when your questions involve what buyers actually said, or when the analyst queue is longer than your sales cycle. This guide compares all four categories on the same criteria, tells you when NOT to choose each, and ends with a decision framework instead of a feature dump.
Most software roundups rank tools on feature checklists nobody weighted. We compared categories on five criteria that actually decide whether a dashboard gets used:
We also drew on our own experience: Sybill sits on top of CRMs daily, our team has lived inside Salesforce and HubSpot reporting, and we built our own AI dashboard feature precisely because of where the other categories hit their ceilings. That makes us informed and biased, so we will tell you plainly when not to choose us.

Choose native CRM dashboards if your questions are standard pipeline views, your budget is spent, and your data hygiene is decent.
Choose a BI platform if you have a RevOps analyst or data team, questions that span CRM plus finance plus product data, and patience for setup.
Choose a plug-and-play dashboard tool if you want good-looking, shareable dashboards this week and your questions are metric display, not deep analysis.
Choose AI-generated dashboards if your questions involve conversations (objections, competitors, buyer sentiment), or if the people with questions are not the people who can write queries.
Now the honest detail on each.
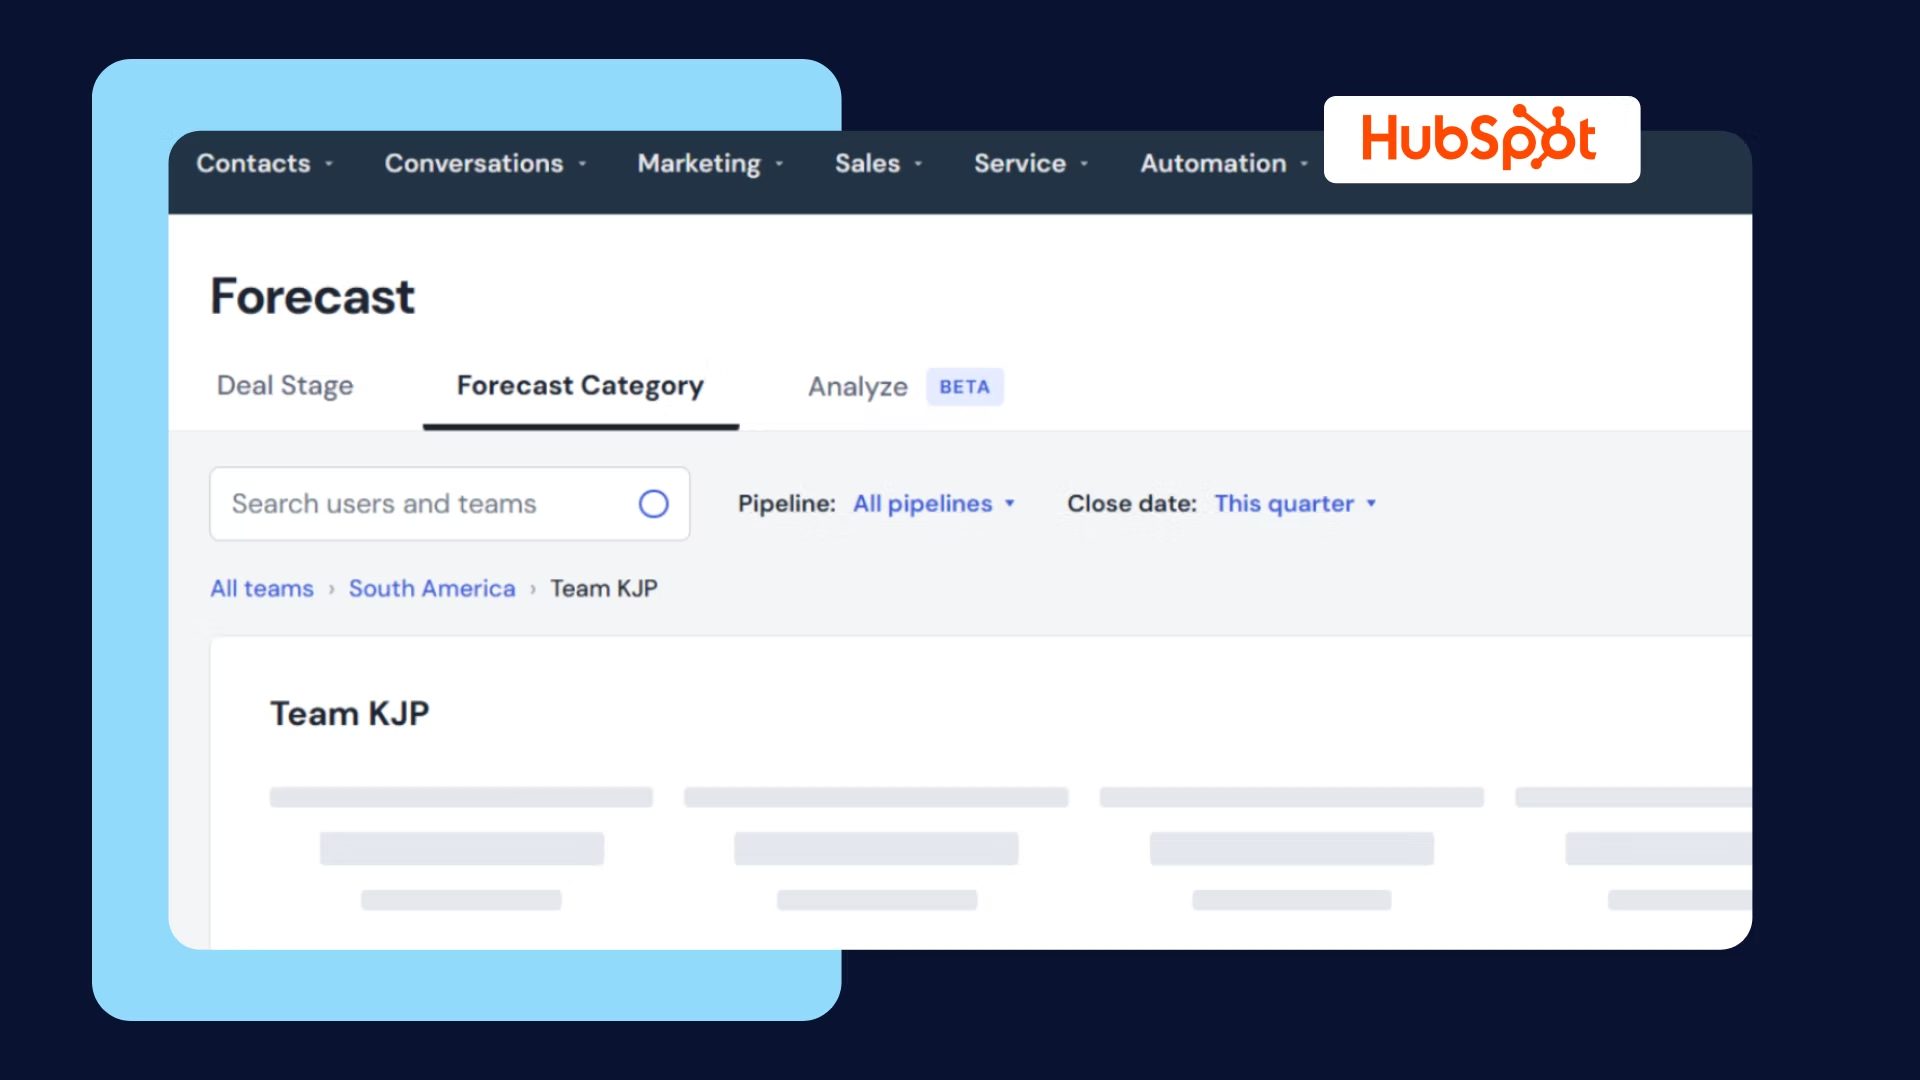
Credit where it is due: if your deals live in Salesforce or HubSpot, their native dashboards are the correct starting point, and plenty of teams never need more. The data connection is zero-work, standard reports (pipeline by stage, attainment, activity) come nearly out of the box, and the cost is bundled into what you already pay.
Best for: teams whose questions match the standard report library, admins who know their CRM well, and anyone who has not yet outgrown one system of record.
The ceiling: two-fold. First, customization past the standard library becomes somebody's part-time job; Salesforce report builders are powerful and famously not self-explanatory. Second, and structurally, native dashboards can only chart CRM fields. Every blind spot in your CRM data (unlogged calls, stale stages, empty fields) becomes a confident, wrong number on a chart. As we covered in what makes dashboards fail, that garbage-in problem kills more dashboards than bad design ever has.
When not to choose it: when your questions start with "why," when data spans systems, or when your CRM hygiene is the thing you are trying to diagnose. A dashboard cannot audit the data it is made of.
These are the heavyweights, and they earned it. If you can pipe data into them, they can visualize it: CRM plus billing plus product usage plus marketing attribution in one governed view. For executive reporting across a whole company, nothing else in this comparison competes.
Best for: organizations with a data team or a strong RevOps analyst, questions that genuinely span systems, and reporting that needs governance, permissions, and polish.
The ceiling: the humans. Every new view goes through whoever owns the tool, which means the real cost is not the license, it is the queue. A sales manager with a Tuesday question gets a Thursday-next-week answer, and by then the question changed. BI tools also inherit the same data blind spot as native dashboards: they visualize what systems recorded, and no system of record captures what the buyer said in minute thirty-eight of the demo.
When not to choose it: when you do not have an analyst (the tool will become shelfware with a login page), when speed of iteration matters more than polish, or when sales conversations are where your answers live.
Pricing note: all three price per user with tiers that change often. Verify against current pricing pages before budgeting; figures reprinted in blog posts age badly, ours included, which is why we are not printing any.
The honest middle ground. These tools exist because BI platforms are heavy and native CRM dashboards are ugly, and they solve exactly that: pre-built connectors, good-looking templates, TV-mode displays for the sales floor, live in days not quarters.
Best for: small and mid-size teams that want metric visibility fast, leaders who want a shared scoreboard without a data hire, and teams whose questions are "show me the number" rather than "explain the number."
The ceiling: depth. These are display layers, not analysis layers. They chart the metrics your connected tools expose, and when you want to slice deeper (why did win rate drop in this segment?), you are back to exporting CSVs. Same conversation blind spot as the two categories above.
When not to choose it: when your questions require joining data across systems in nonstandard ways, or when display was never your problem and data quality was.
This is the newest category and the one we built, so read this section knowing it is the best solution.
The premise: the three categories above all share two limits. They require someone to build each view, and they can only see what got typed into systems. AI-generated dashboards attack both. In Sybill, you describe the dashboard in plain English ("show me the objections in every deal we lost last quarter, broken down by competitor") and get an interactive dashboard in seconds, built on calls, emails, and CRM data together. Refresh it with the latest data, export it as PDF or HTML, share it by link with people who never log into Sybill. We covered the full feature in this blog.
Best for: teams whose questions involve buyer reality (objections, competitor mentions, sentiment, engagement), managers and execs who want answers without a queue, and teams already using Sybill for calls and CRM autofill, where the conversation data is already flowing.
The honest limits: Sybill is a revenue tool, not a company-wide BI platform. If you need finance, marketing, and product dashboards under one governed roof, that is Tableau or Looker territory, and we will not pretend otherwise. And AI-generated dashboards are only as strong as the conversation data behind them: a team that records few calls gives the AI little to reason over.
When not to choose it: company-wide non-sales reporting, or if your only need is a basic pipeline widget, in which case your CRM's free native dashboard is genuinely the right answer.

Strip away the logos and the choice comes down to three questions about your team, not the tools.
Do your questions start with "what" or "why"? What-questions (pipeline value, attainment, activity counts) are served by any category. Why-questions (why deals stall, why win rate dropped in a segment, what objections cost you) need conversation data, and only one category has it natively. As we argued in our KPI guide, the metrics that matter most now are the ones traditional systems never captured.
Who has the questions, and who can build the answers? If those are different people, every category except AI-generated puts a queue between them. Measure your current queue honestly: if a new dashboard request takes more than a week, your team has already stopped asking most of its questions. That silence is the expensive part.
What is your data actually worth charting? If reps update the CRM manually and sporadically, fix capture before buying visualization; automated CRM autofill upgrades every category in this guide, because every one of them charts whatever the CRM contains. Polishing charts on top of stale fields is redecorating a house with a foundation crack.
Your team has targets, not vibes, and the right software is whichever one turns this Monday's question into this Monday's answer.
What is the best software for sales dashboards?
It depends on your questions and resources. Native CRM dashboards (Salesforce, HubSpot) are best for standard pipeline views at no extra cost. BI platforms (Tableau, Power BI, Looker) are best for cross-system executive reporting when you have an analyst. Plug-and-play tools (Databox, Geckoboard) are best for fast, shareable metric displays. AI-generated dashboards like Sybill's are best when questions involve conversations, objections, competitors, and buyer sentiment, or when you want dashboards without an analyst queue.
Can I build sales dashboards without a BI tool?
Yes. Native CRM dashboards cover standard views without extra tooling, plug-and-play tools add polish in days, and AI-generated dashboards let anyone create custom views from a plain-English prompt in seconds. A dedicated BI tool is only necessary when reporting must span many systems under central governance.
Are Salesforce dashboards good enough for a sales team?
For standard pipeline, attainment, and activity reporting, yes, and they are the right free starting point. They fall short on why-questions, cross-system views, and anything involving what buyers said on calls, because they can only chart Salesforce fields. Teams usually outgrow them when questions get more specific than the standard report library.
What is an AI sales dashboard?
An AI sales dashboard is one generated from a natural-language prompt rather than built manually in a report builder. You describe the view you want, and the AI queries, structures, and visualizes it. Sybill's version builds dashboards from calls, emails, and CRM data together, so the output can include conversation-level insights like objection frequency and competitor mentions that field-based tools cannot show.
How much does sales dashboard software cost?
Native CRM dashboards are included in existing CRM licenses. BI platforms and plug-and-play tools price per user per month across tiers that change frequently, so verify against each vendor's current pricing page rather than third-party roundups. The larger cost consideration is usually people: BI platforms need analyst time for every new view, which often exceeds the license cost.
It depends on your questions and resources. Native CRM dashboards (Salesforce, HubSpot) are best for standard pipeline views at no extra cost. BI platforms (Tableau, Power BI, Looker) are best for cross-system executive reporting when you have an analyst. Plug-and-play tools (Databox, Geckoboard) are best for fast, shareable metric displays. AI-generated dashboards like Sybill's are best when questions involve conversations, objections, competitors, and buyer sentiment, or when you want dashboards without an analyst queue.
Yes. Native CRM dashboards cover standard views without extra tooling, plug-and-play tools add polish in days, and AI-generated dashboards let anyone create custom views from a plain-English prompt in seconds. A dedicated BI tool is only necessary when reporting must span many systems under central governance.
For standard pipeline, attainment, and activity reporting, yes, and they are the right free starting point. They fall short on why-questions, cross-system views, and anything involving what buyers said on calls, because they can only chart Salesforce fields. Teams usually outgrow them when questions get more specific than the standard report library.