Find us at booth #83, join us for a harbor side happy hour, or catch Gorish’s talk.

Sept, 16-18 > Learn more


Mamta Tainwala

September 14, 2026
Sales win-loss analysis is the systematic study of why deals are won or lost, combining buyer interviews, rep debriefs, and deal records to find repeatable patterns. Done consistently, it sharpens positioning, exposes product gaps, and feeds competitive strategy. Done badly, it produces a quarterly report that confirms whatever the loudest rep already believed.
The full guide below: the seven-step process, the 20 questions that extract real answers, the ratio math, the three failure modes, and the modern fix for the oldest problem in win-loss work, which is that everyone you interview is remembering a deal instead of showing you one.
Want the template first? The win-loss review template gives you the interview form, the analysis structure, and the findings format in one place. Free, no form-fill.
Win-loss analysis (also written win/loss analysis) is a structured feedback process: after deals close (won or lost), you gather evidence from buyer interviews, sales rep debriefs, and the deal record itself to determine what actually drove the outcome. The output is patterns, not anecdotes: which competitors beat you and why, which objections kill deals, which strengths win them.
The operative word is structured. Every sales team does informal win-loss analysis constantly ("we lost that one on price," announced confidently in Slack). The problem is that informal analysis is wrong at a spectacular rate, because it runs on the loser's self-report. Reps attribute losses to price and product gaps; buyers, when actually asked, cite trust, fit, and sales experience far more often. The entire value of a formal program is replacing the comfortable story with the true one.
And the scope is bigger than sales. A good program feeds product (feature gaps buyers actually cited), marketing (the language winning buyers used), pricing (where cost genuinely decided), and competitive strategy (who is beating you, where, with what pitch).

Four returns justify the program: sharper positioning built from real buyer language, competitive intelligence straight from the people who evaluated you against rivals, product roadmap input weighted by revenue impact, and coaching insight into which sales behaviors correlate with wins. The compounding effect is a playbook that updates itself every quarter instead of fossilizing.
Let us be adults for a second about why most teams skip it anyway: it feels like homework about the past when everyone's comp plan is about the future. The counterargument is arithmetic. If your team closes 25% of qualified deals, then for every win there are three losses carrying paid-for lessons nobody collected. Win-loss analysis is the only motion that recovers value from the 75% of your pipeline that died.
Where the returns land:
Positioning. Winning buyers tell you which message actually landed, in their words. That language belongs in your decks and your battlecards, verbatim.
Competitive strategy. Losses tell you exactly how competitors position against you, which claims stick, and which of their weaknesses buyers volunteer unprompted. This is intelligence money cannot buy from any analyst report.
Product. Not every requested feature matters. Win-loss weights product gaps by deals actually lost to them, which is the roadmap prioritization argument product teams respect.
Coaching. Patterns across losses (single-threaded deals, skipped discovery, unresolved pricing objections) become the coaching agenda, targeted at behaviors that verifiably cost revenue. The best win-loss moments become shared call snippets the whole team learns from, which beats a findings memo every time.
Conduct a win-loss analysis in seven steps: define which deals count, pull the deal record before anyone talks, interview a balanced sample of buyers within two weeks of the decision, debrief the rep separately, code every finding to a fixed set of themes, calculate segmented win rates, and route each finding to an owner with a deadline. Repeat quarterly.
Step 1: Define the population. Decide what counts as a closed deal for this analysis: reached a real evaluation, had a competitor or a status quo alternative, closed in the period. Write the rule down. A population that shifts quarter to quarter produces trend lines that mean nothing.
Step 2: Pull the record before anyone talks. For every deal in the sample, review the conversation summaries, the stage history, and the stakeholders before the interview. You are looking for the specific moments to ask about, and for the gap between what the record shows and what the CRM says. This step is what separates a grounded interview from a polite one.
Step 3: Interview buyers, fast and small. Aim for a balanced sample of wins and losses, weighted toward the segments you care about. Ask within two weeks of the decision, keep it to 20 minutes, use someone other than the rep, and pick five to seven questions from the bank below.
Step 4: Debrief the rep, separately. Same day if possible, before they hear what the buyer said. You want their unanchored account of the turning points, the competition, and the internal roadblocks.
Step 5: Code every finding. Tag each answer against a fixed theme list: pricing, product gap, competitor strength, sales process, timing, champion strength, trust. Fixed themes are what make ten interviews aggregate into a pattern instead of ten stories. The win-loss themes template ships with a starting theme list.
Step 6: Run the numbers by segment. Win rate and win-loss ratio by competitor, deal size, segment, and lead source. The blended number is where insights go to hide; the segmented numbers are where they surface.
Step 7: Route findings to owners. Every theme that shows up more than once gets an owner, an artifact to change (battlecard, play, roadmap item, coaching plan), and a deadline. Then close the loop publicly next quarter: here is what changed because of the last round.
The classic version of this runs quarterly on a sample. The modern version runs steps 2, 5, and 6 continuously on every recorded deal and reserves interviews for step 3 on the deals that justify them. More on that below.

A useful win-loss analysis produces a small number of coded themes with a revenue figure attached to each, a segmented win rate that shows where the pattern concentrates, and a named owner for every finding. It does not produce a 40-slide deck.
Here is an illustrative composite of what a quarter's output looks like for a mid-market SaaS team (details are representative, not a specific customer):
Notice what this does and does not contain. Three themes, each with a count, a revenue weight, a segment, an owner, and an artifact. No general recommendations. And notice that the biggest finding came from the record, not the interviews: nine reps said price, the calls said security. That disagreement is the whole reason to ground interviews in the conversation record.
Effective win-loss interviews use open-ended questions in four sets: wins (what tipped the decision, what nearly lost it), losses (who won and why, what you lacked), rep debriefs (turning points, internal roadblocks), and universal questions (brand perception, pricing's real role). Ask about the decision process, not just the decision.
The bank, battle-tested. Pick five to seven per interview; nobody owes you an hour.
One craft note that separates useful interviews from polite ones: never ask a question the record can answer. "Did pricing come up?" is in the call transcript. Interview time is for the questions only the buyer can answer: what they felt, what they compared, what they said about you in the meeting you were not in. If you want a structured form for capturing answers, the win-loss review template is built for exactly this.

Win-loss ratio = deals won ÷ deals lost in a period. Thirty wins against fifteen losses gives a ratio of 2, meaning two wins per loss. Its close cousin, win rate, is wins ÷ total closed deals: the same thirty wins from forty-five decided deals is a 67% win rate. Track both by segment, competitor, and deal size, because the blended number hides everything interesting.
Three rules that keep the math honest:
Define the denominator ruthlessly. Only count deals that reached a real evaluation. Padding the denominator with unqualified leads makes the ratio meaningless; excluding embarrassing losses makes it flattering fiction. Your qualification framework defines what counts, and it should not move quarter to quarter. This also assumes closed-deal data you can trust, which is an argument for CRM records that update themselves instead of relying on end-of-quarter cleanup.
Segment before concluding. A 2.0 blended ratio can hide a 4.0 against Competitor A and a 0.5 against Competitor B, which is not one insight but two urgent, opposite ones. Segmented ratios also feed straight into forecast conversations, since win rate by segment is the multiplier the whole forecast runs on.
Watch the trend, not the snapshot. The ratio's job is direction. Pair it with deal inspection on the live pipeline and the ratio becomes a leading conversation, not a lagging autopsy.
Your win-loss evidence already exists. It is sitting in your call recordings. Sybill turns every deal's conversations into searchable, analyzable truth: what buyers said, objected to, and decided on.
Get started for free with Sybill
The three classic failure modes: low buyer participation (busy people decline interviews), recall bias (everyone remembers a story, not the deal), and shelf-ware insights (findings that never change behavior). The fixes: interview fast and small, ground every interview in the deal's actual conversation record, and assign each finding an owner and a deadline.
Failure 1: Nobody agrees to the interview. Buyers, especially ones who rejected you, do not owe you an hour. Fixes that work: ask within two weeks of the decision while it is fresh, keep it to 20 minutes, have someone other than the deal's rep conduct it (candor doubles), and offer a modest thank-you. Accept that you will interview a sample, which is precisely why the deal record has to carry the rest of the load.
Failure 2: Recall bias eats the data. This is the quiet killer. Interviews happen weeks after decisions that took months. The buyer remembers a narrative. The rep remembers a defensible narrative. Neither remembers the third call, where the deal actually turned. The fix is grounding: review the deal's conversation summaries before every interview, so your questions probe specifics ("in the second demo, your engineering lead pushed hard on the API limits; how did that factor in?") instead of inviting reconstruction. Specific questions get specific answers. Vague questions get folklore.
Failure 3: The report gathers dust. Insights without owners are trivia. Every finding gets routed: product gaps to the roadmap owner with the revenue tally attached, competitive patterns into refreshed sales plays, objection patterns into the objection-handling playbook and next month's coaching plan, messaging wins to marketing. RevOps makes the natural process owner, with sales leadership accountable for the behavior changes. Then the loop closes publicly: share what changed because of the last round, and watch participation in the next round jump.
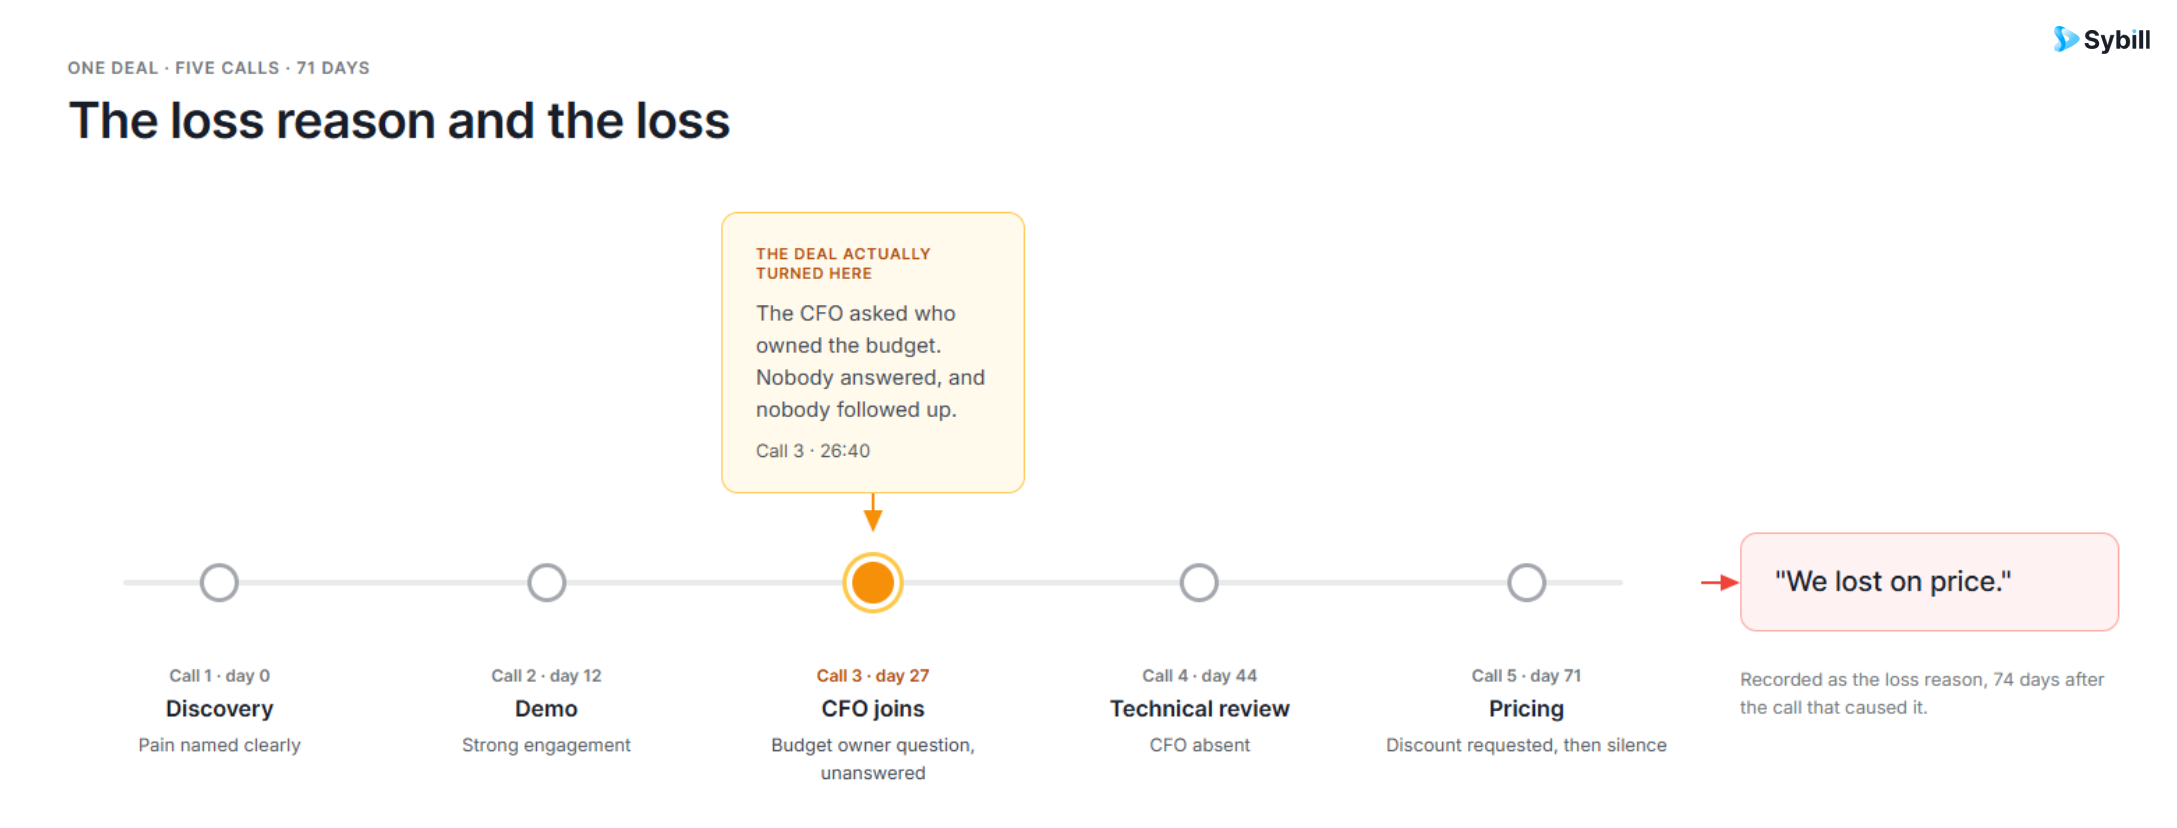
AI converts win-loss from a sampled, retrospective interview program into continuous analysis of every deal. Conversation intelligence preserves what was actually said across each deal's full lifecycle, pattern analysis runs across all wins and losses instead of the ten you had time to study, and the interview evolves from primary evidence into a supplement for the questions records cannot answer.
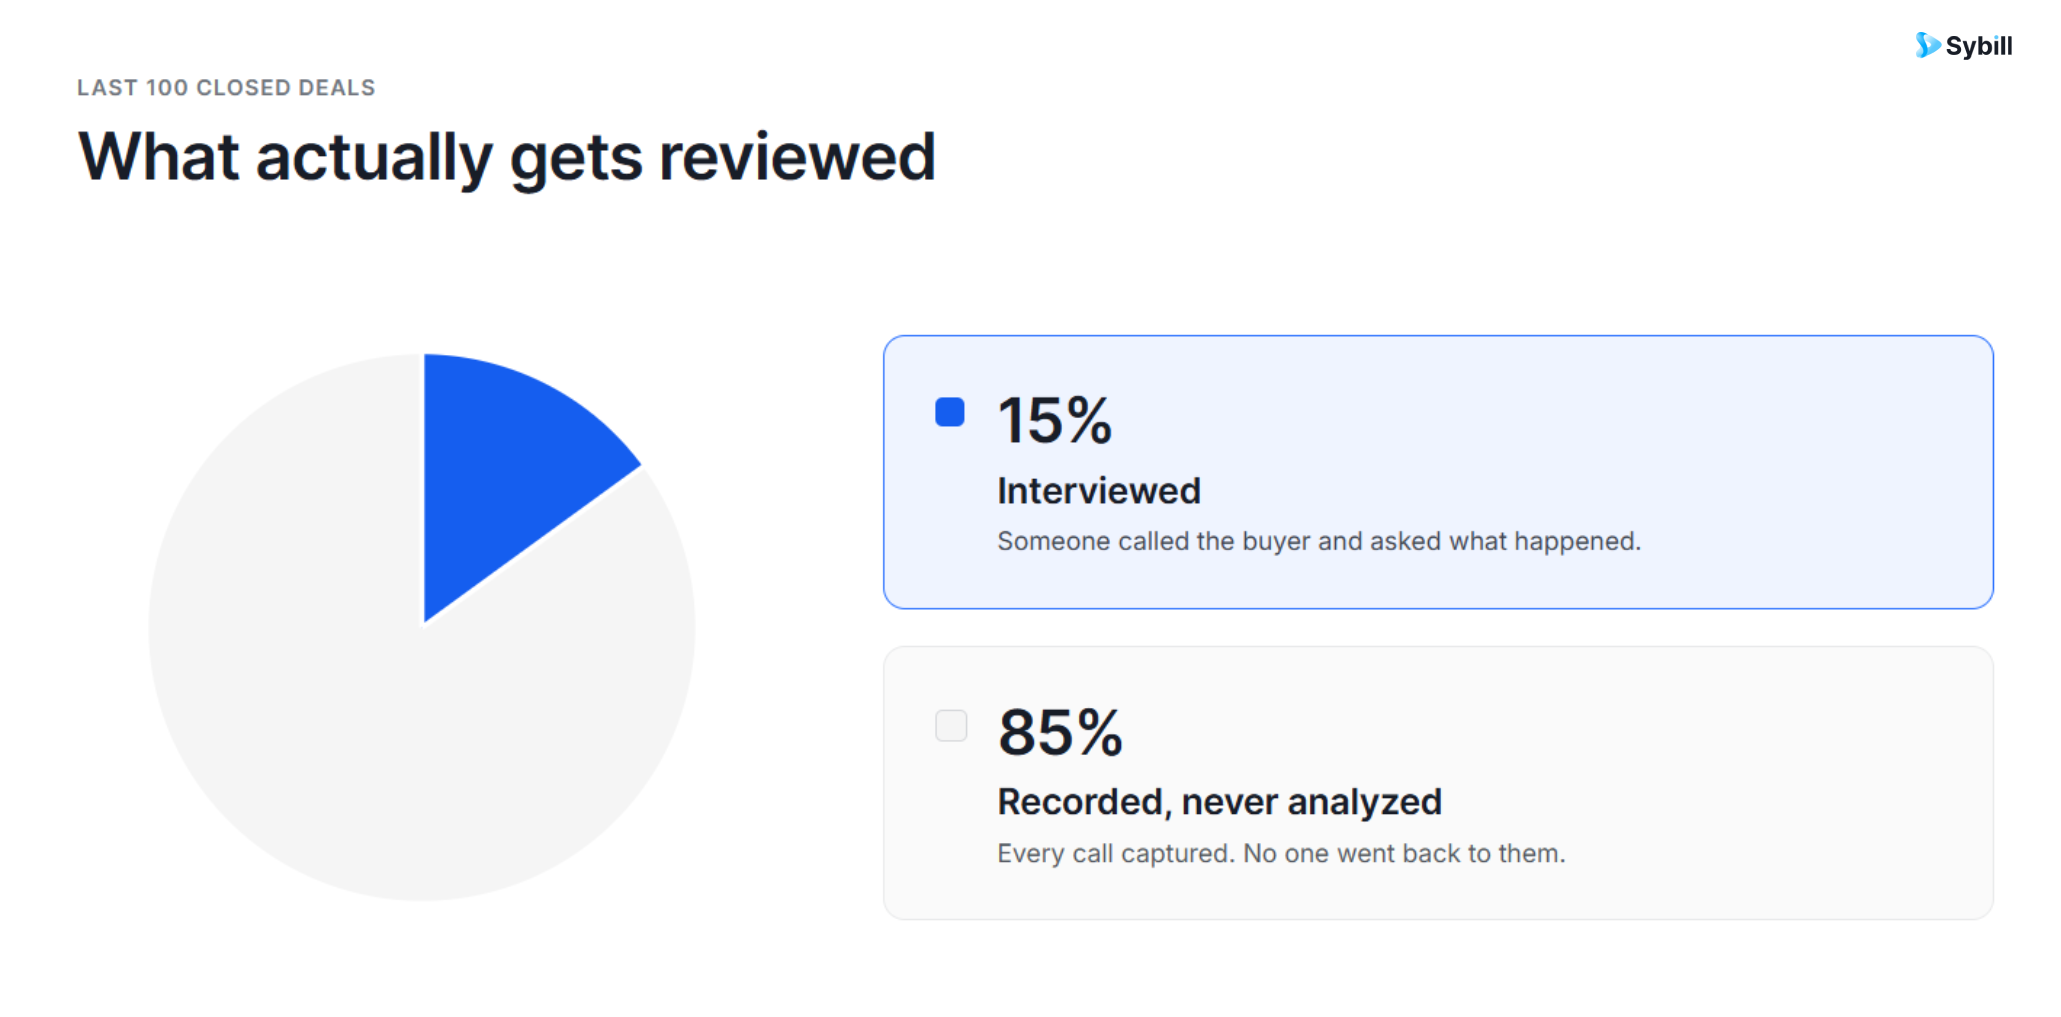
The traditional program has a coverage problem hiding in plain sight: a diligent team interviews maybe 10 to 20% of closed deals. The other 80% close in silence, lessons unharvested. Meanwhile, every one of those deals left a complete evidence trail: discovery calls, demos, negotiations, all recorded.
What running win-loss on that trail looks like:
Ask the corpus directly. Ask Sybill answers questions across every deal's conversations: "What did buyers in lost deals say about implementation timelines?" "Which objections appeared in wins versus losses?" Across around 33 million sales calls analyzed, the recurring finding is that the stated reason for a loss and the conversational evidence of the loss frequently disagree. The record wins that argument. The win-loss themes template is a ready-made prompt set for running exactly this analysis.
Patterns instead of anecdotes. Buyer intelligence aggregates needs, blockers, and priorities across segments, so "we keep losing mid-market deals on integrations" arrives as a measured pattern with receipts, not a rep's hunch.
Plays that encode the lessons. The endpoint of win-loss is behavior change, and sales plays built from your wins and losses close that loop: the guidance reps see on live deals reflects what actually worked on similar past deals. Our step-by-step guide to using AI for win-loss analysis walks through the workflow.
To be fair to the interview: it still owns the questions no recording contains: the buyer's internal politics, the meeting you were not in, the perception formed before you ever spoke. Dedicated win-loss firms and platforms like Clozd do rigorous interview programs well. The modern architecture uses both: records for what happened, interviews for what it meant. If you are choosing tooling, our roundup of the best win-loss analysis software compares the interview platforms, the competitive intelligence suites, and the conversation-based tools side by side.
Every lost deal already cost you the CAC, the rep hours, and the quarter-end scramble. The only remaining question is whether you also collect the lesson, and most teams do not, because the lesson requires asking uncomfortable questions and believing evidence over ego.
The teams that do it build a compounding advantage that is nearly invisible from outside: their positioning gets sharper every quarter, their battlecards describe the competitor's actual pitch, their coaching targets the behaviors that verifiably lose deals, and their win rate creeps up in a way rivals cannot reverse-engineer. Our win-loss analysis templates are the shortcut to getting that loop running this quarter.
Your next quarter's win rate is hiding in last quarter's losses. Sybill keeps the evidence, finds the patterns, and turns them into the plays your team runs next.
Get started for free with Sybill
Start with 10 to 15 deals per quarter for interviews, balanced across wins and losses and weighted toward strategic segments. With conversation intelligence, pattern analysis should cover all closed deals, since the recorded evidence exists regardless. The interview sample adds depth; the full-corpus analysis provides the statistics.
Someone other than the rep who worked the deal: a RevOps analyst, product marketer, competitive intelligence lead, or third-party firm. Buyers are measurably more candid with a neutral party, and reps interviewing their own losses tend to hear what protects the narrative rather than what challenges it.
There is no universal benchmark; it depends on qualification strictness and market position. A team that only counts rigorously qualified deals will show a higher ratio than one counting every opportunity. The useful reading is your own trend over time, segmented by competitor, deal size, and segment.
Win rate is wins divided by all closed deals, expressed as a percentage: 30 wins from 45 decided deals is 67%. Win-loss ratio is wins divided by losses: the same quarter shows a ratio of 2.0. They convey the same performance in different forms; most revenue teams report win rate and use the ratio for quick comparisons.
Continuously for the data layer, quarterly for the synthesis. Deal evidence should be captured and pattern-analyzed as deals close, while formal reviews (findings, owners, playbook updates) work best on a quarterly rhythm aligned with planning cycles. Annual-only programs produce museum reports about a market that has already moved.
Start with 10 to 15 deals per quarter for interviews, balanced across wins and losses and weighted toward strategic segments. With conversation intelligence, pattern analysis should cover all closed deals, since the recorded evidence exists regardless. The interview sample adds depth; the full-corpus analysis provides the statistics.
Someone other than the rep who worked the deal: a RevOps analyst, product marketer, competitive intelligence lead, or third-party firm. Buyers are measurably more candid with a neutral party, and reps interviewing their own losses tend to hear what protects the narrative rather than what challenges it.
There is no universal benchmark; it depends on qualification strictness and market position. A team that only counts rigorously qualified deals will show a higher ratio than one counting every opportunity. The useful reading is your own trend over time, segmented by competitor, deal size, and segment.