Find us at booth #83, join us for a harbor side happy hour, or catch Gorish’s talk.

Sept, 16-18 > Learn more

%20(1).avif)
Mamta Tainwala

July 19, 2026
%20(44).png)
The 10 metrics that measure product-led sales performance: activation rate, time to value, product-qualified leads (PQLs), free-to-paid conversion rate, sales-assisted conversion rate, time to convert, expansion revenue rate, net revenue retention, churn rate, and customer lifetime value. Together they cover the three stages of a PLS motion: getting users to value, converting them to revenue, and growing the accounts you keep.
Formulas, benchma... no, wait. First, a necessary word about why most lists of PLS metrics will quietly sabotage your dashboard.
Product-led sales (PLS) is a go-to-market motion where the product generates and qualifies demand through free trials, freemium tiers, and self-serve usage, and sales engages selectively where human help increases conversion or deal size. Its metrics differ from sales-led metrics because the funnel starts with product behavior, not a discovery call: usage signals replace BANT as the first qualification layer.
If you are still deciding whether this motion fits your business, start with our guide to what product-led sales is and when to adopt it. This post assumes you are already running some version of it and want to know whether it is working.
Which brings up the sabotage problem. Because PLS sits between product, marketing, and sales, metric lists for it tend to become a junk drawer: website traffic, social mentions, brand sentiment. Those are fine marketing numbers. None of them tells you whether your product is converting users into revenue, which is the only question a PLS dashboard exists to answer. The previous version of this very post committed that sin, so consider this the correction.
The test for whether a metric belongs on a PLS dashboard: does it measure how users move from product experience to revenue? Everything below passes. Traffic and mentions do not.
The 10 metrics split across three stages. Activation metrics (activation rate, time to value) measure whether users reach the product's core value. Conversion metrics (PQLs, free-to-paid rate, sales-assisted conversion, time to convert) measure whether value becomes revenue. Expansion metrics (expansion revenue rate, NRR, churn, CLV) measure whether revenue compounds.
Here is each one, with the formula and the trap.
What it measures: The percentage of new sign-ups that complete the action (or set of actions) representing your product's core value: the "aha moment." Formula: (Users completing activation event ÷ Total sign-ups) × 100 The trap: Defining activation as "logged in twice" because it makes the number look good. Activation must be the behavior that correlates with eventual conversion in your own data, or the metric is decorative. Find it by working backward from your paying customers' first-week behavior.
What it measures: How long it takes a new user to reach that activation moment. Formula: Median time from sign-up to activation event The trap: Using the average instead of the median, which lets a few stuck users hide the healthy majority (or vice versa). TTV is the single best predictor of trial conversion you control directly: every onboarding improvement shows up here first, weeks before it shows up in revenue.
What it measures: Users or accounts whose product behavior signals buying intent: hitting usage limits, inviting teammates, adopting premium-gated features. The PLS equivalent of an MQL, except based on what people did instead of what they downloaded. Formula: Count of accounts meeting your PQL criteria per period, plus PQL-to-opportunity conversion rate The trap: Setting PQL criteria once and never revisiting them. Your PQL definition is a hypothesis about which behaviors predict revenue. Test it quarterly against actual closed-won data, the same way you would pressure-test any lead scoring model.
What it measures: The percentage of trial or freemium users who become paying customers. Formula: (Converted users ÷ Total trial or free users) × 100 The trap: Comparing your rate to generic benchmarks. Opt-in trials, opt-out trials with credit cards, and freemium models convert at wildly different rates by design. Benchmark against your own trend line and your segment, not a LinkedIn infographic.
What it measures: The conversion rate of PQLs that sales touched versus those that self-served, and the revenue lift when sales engages. Formula: (Sales-touched PQLs converted ÷ Sales-touched PQLs) × 100, compared against the self-serve rate and average contract value for both paths The trap: Not tracking it at all, which is the norm. This is the metric that justifies the "S" in PLS. If sales-touched conversions are not meaningfully higher in rate or deal size than self-serve, your sales motion is expensive decoration. If they are, you have a case for more sales-assist coverage. Either answer is worth knowing.
What it measures: Median time from sign-up (or from PQL) to paid subscription. Formula: Median duration from sign-up or PQL date to first payment The trap: Treating longer as always worse. Enterprise-tier PLS deals with procurement lawyers convert slowly and are worth the wait. Segment this metric by deal size before drawing conclusions.
What it measures: The share of new revenue coming from existing customers through upsells, cross-sells, seat growth, and usage growth. Formula: (Expansion MRR ÷ Total new MRR) × 100 The trap: Celebrating a high percentage that is actually a symptom of weak new-logo acquisition. Read this metric alongside your pipeline generation numbers, not instead of them.
What it measures: Revenue retained and expanded from an existing customer cohort after churn and contraction. The single number investors read first in a PLS business, because a self-serve motion lives or dies on whether accounts grow themselves. Formula: ((Starting MRR + Expansion − Churn − Contraction) ÷ Starting MRR) × 100 The trap: Benchmarking against 2021-era targets. Current segment medians run roughly 118% enterprise, 108% mid-market, 97% SMB per SaaS Capital's 2025 data. We wrote the full NRR guide and a playbook on how to improve it.
What it measures: The percentage of customers (logo churn) or revenue (revenue churn) lost per period. Formula: (Lost customers or MRR ÷ Starting customers or MRR) × 100 The trap: Tracking logo churn alone. Losing ten $50/month accounts and losing one $5,000/month account are the same logo-churn story and a very different business story. Track both, and run churn analysis on the why, not just the how much.
What it measures: Total expected revenue per customer relationship, the ceiling on what you can rationally spend to acquire and serve them. Formula: Average revenue per account × Average customer lifespan (or ARPA × gross margin ÷ churn rate for the more honest version) The trap: Computing CLV from your oldest, most loyal cohort and applying it to everyone. Cohort your CLV by acquisition channel and segment, or it will flatter every decision you feed it into.
Your PQLs become revenue in conversations, not dashboards. Sybill captures every sales-assist call, updates the CRM, and drafts the follow-ups, so the handoff from product signal to closed deal never drops. Try it for free.
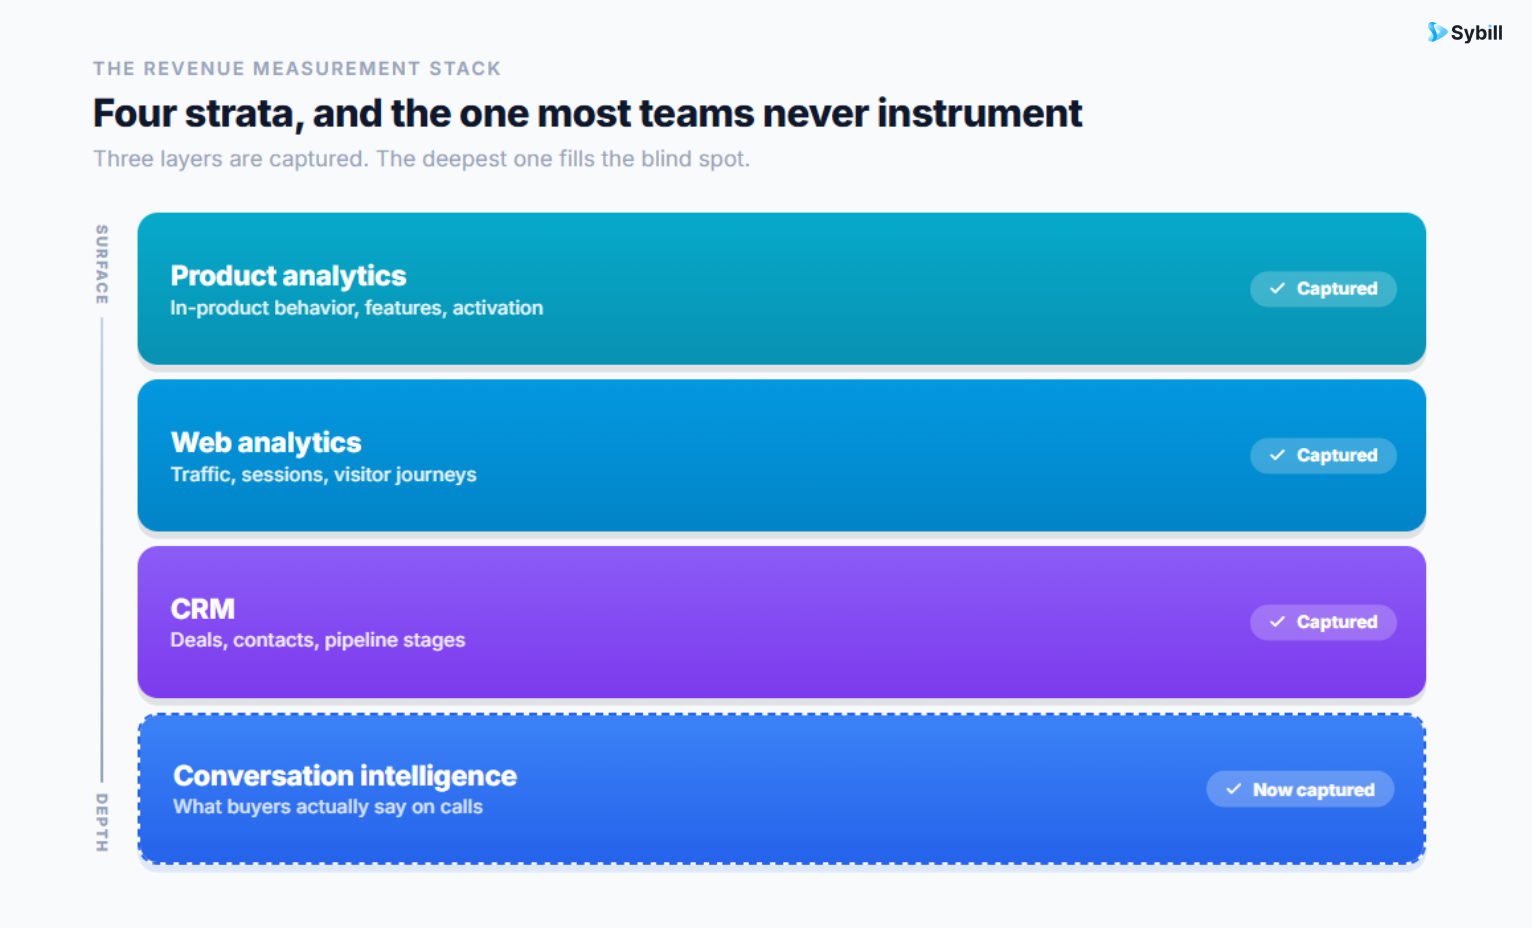
A working PLS measurement stack has four layers: product analytics (Amplitude or Mixpanel) for activation and usage, web analytics (GA4) for acquisition sources, the CRM (Salesforce or HubSpot) for pipeline and revenue, and conversation intelligence for the sales-assist layer where PQLs become deals. Most teams have the first three and a blind spot where the fourth should be.
Quick, honest rundown:
Amplitude and Mixpanel own the product layer: activation funnels, cohort retention, the behavioral data your PQL definitions run on. Both are excellent; pick based on your team's existing skills and pricing tier, not on feature-list battles.
GA4 tells you where sign-ups come from, which keeps your acquisition spend honest. Necessary, not sufficient.
Your CRM holds the revenue truth: opportunities, conversion, expansion. The catch in a PLS motion is that CRM data is only as current as whoever updates it, and sales-assist teams juggling hundreds of product-signal-driven touches update it worst of all. Automating CRM hygiene from actual conversations is how RevOps teams keep metrics 3 through 6 trustworthy without nagging anyone.
The conversation layer is the blind spot. Metrics 5 and 6 (sales-assisted conversion, time to convert) hinge on what happens in the calls between PQL and closed-won, and product analytics cannot see into a Zoom call. Magic summaries capture what happened, deal inspection flags which sales-assisted deals are stalling and why, and Ask Sybill answers the questions your dashboard cannot: "What do PQLs who don't convert say about pricing?" Sybill has analyzed thousands to lakhs of sales conversations, and the gap between what product data predicts and what buyers actually say on calls is where most PLS conversion problems hide.
To be clear about lanes: Sybill is not a product analytics tool and will not replace Amplitude. It covers the human-conversation layer of a PLS motion, which is exactly the layer the rest of the stack cannot reach.
Build it in four steps: define the revenue goal each metric serves, assign one owner per metric across product, sales, and CS, set review cadences (weekly for activation and PQL flow, monthly for conversion, quarterly for expansion), and wire the metrics into decision meetings so numbers trigger actions instead of screenshots.
The condensed operating manual:
Anchor every metric to a decision. "Activation rate dropped" should trigger an onboarding review. "Sales-assisted conversion beats self-serve by 3x on accounts over 50 seats" should trigger a coverage change. If a metric moving would change nothing, remove it from the dashboard. Dashboards are for decisions, not decoration.
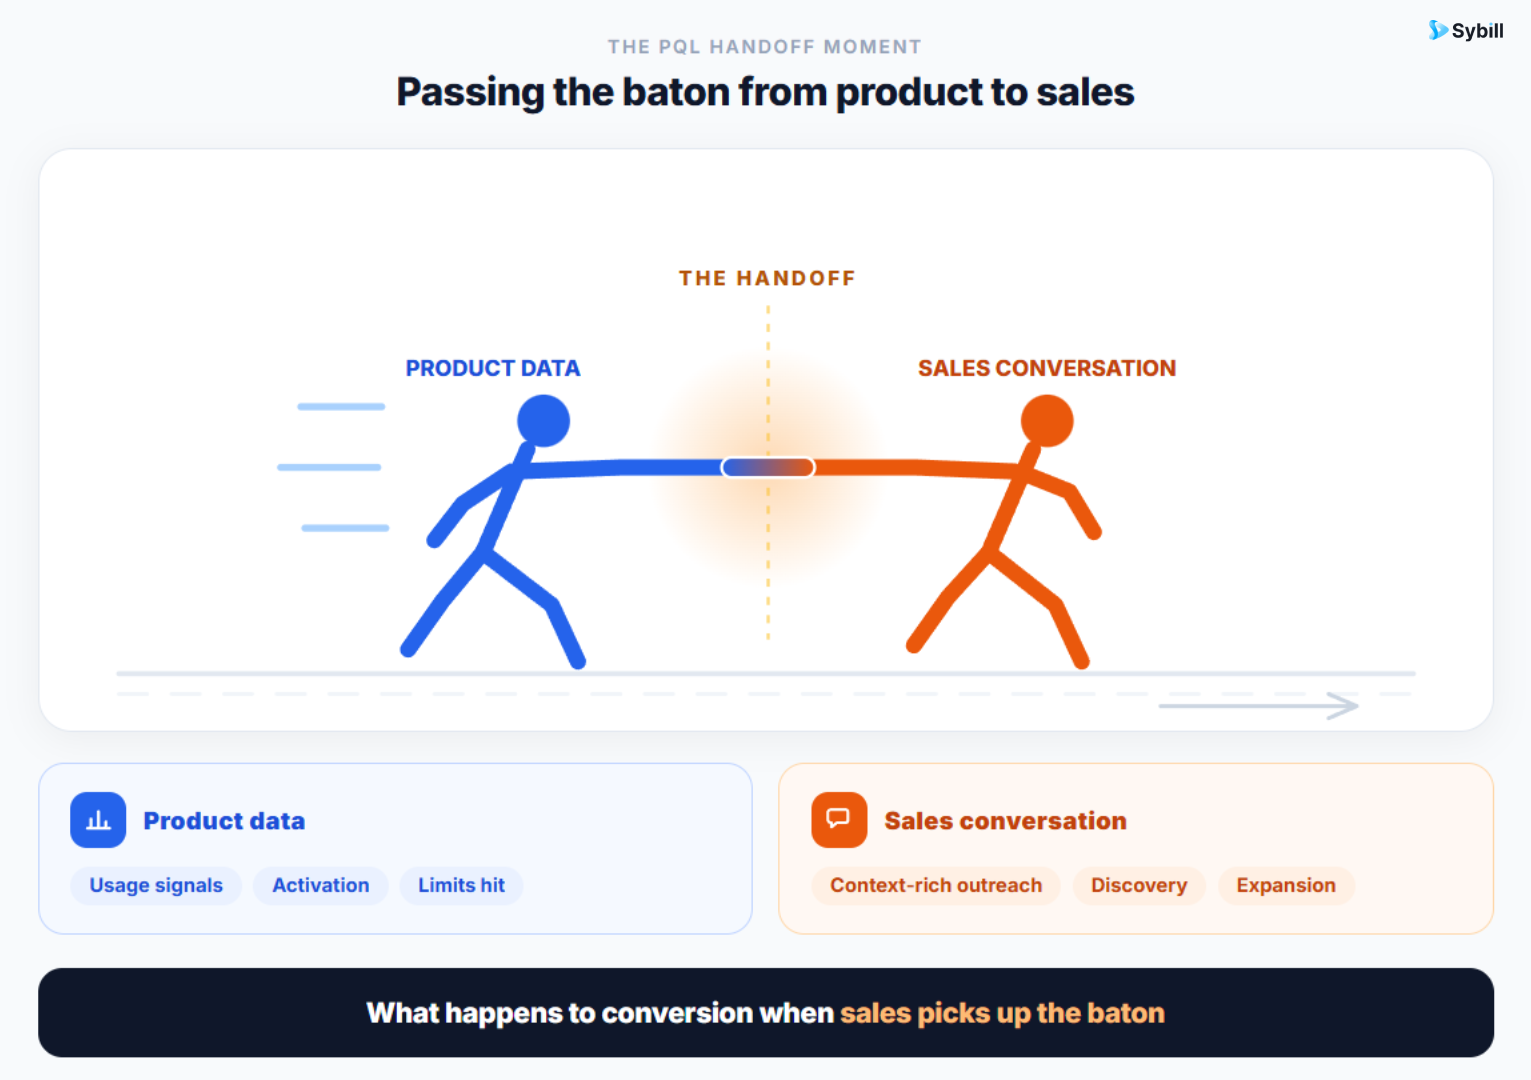
Give each metric one owner. PLS metrics die in the gaps between teams: product owns activation, sales owns conversion, CS owns expansion, and nobody owns the handoffs. Name owners for the seams too, especially the PQL handoff, and keep every account's full story in one place so the owner actually has the context.
Match cadence to metric speed. Activation and PQL volume move weekly; review them weekly. NRR and CLV move quarterly; reviewing them weekly just teaches your team to explain noise. Feed the fast metrics into pipeline meetings and the slow ones into forecast and planning reviews.
Close the loop with qualitative data. When a metric moves and the dashboard cannot say why, the answer is almost always in conversations: what churned customers said in their last three calls, what converting PQLs asked about that stalled ones did not. Buyer intelligence across your call base turns "the number went down" into "the number went down because mid-market trials keep hitting the same integration wall." One of those is a status update. The other is a roadmap input.
Here is the whole post in two sentences. Product-led sales performance is measured by how efficiently users move from first value to first dollar to growing account, and the ten metrics above trace exactly that path. Everything else on your dashboard is either upstream marketing or downstream finance, and both deserve their own dashboards, somewhere else.
And one closing conviction, earned from watching PLS teams stall: the motion is called product-led, but the revenue is still conversation-closed. The PQL that converts got a well-timed, context-rich human touch. The account that expanded had a call where someone actually heard the growth signal. Product data starts the story. Conversations finish it.
Sybill makes sure the finishing goes as well as the starting.
Start free or book a demo and put the conversation layer on your PLS dashboard.
A PQL is a user or account whose product behavior signals buying intent: hitting usage limits, inviting teammates, adopting premium features, or reaching activation milestones that historically correlate with conversion. PQLs replace form-fill-based MQLs as the primary qualification signal in product-led sales, because behavior predicts revenue better than downloads do.
It depends heavily on model. Freemium products typically convert a low single-digit percentage of free users, opt-in free trials commonly convert in the mid-teens, and opt-out trials requiring a credit card convert substantially higher by design. Benchmark against your own trend line and trial type rather than a single universal number.
Product-led growth (PLG) is the broader strategy of using the product as the primary acquisition and retention engine, often fully self-serve. Product-led sales (PLS) adds a targeted sales motion on top: reps engage the accounts where human involvement raises conversion or contract value, guided by product usage signals rather than cold prospecting.
Activation rate, because everything downstream depends on it. If users never reach your product's core value, no amount of PQL scoring, sales assistance, or expansion play will manufacture revenue. Define activation from the first-week behaviors your paying customers actually shared, then optimize time to value against it.
Most do, above a certain deal size. Self-serve handles low-ACV conversion efficiently, but multi-seat, security-reviewed, procurement-involved deals convert at higher rates and higher contract values with sales assistance. The sales-assisted conversion metric answers this empirically for your own business: measure the lift, then staff to it.
A PQL is a user or account whose product behavior signals buying intent: hitting usage limits, inviting teammates, adopting premium features, or reaching activation milestones that historically correlate with conversion. PQLs replace form-fill-based MQLs as the primary qualification signal in product-led sales, because behavior predicts revenue better than downloads do.
It depends heavily on model. Freemium products typically convert a low single-digit percentage of free users, opt-in free trials commonly convert in the mid-teens, and opt-out trials requiring a credit card convert substantially higher by design. Benchmark against your own trend line and trial type rather than a single universal number.
Product-led growth (PLG) is the broader strategy of using the product as the primary acquisition and retention engine, often fully self-serve. Product-led sales (PLS) adds a targeted sales motion on top: reps engage the accounts where human involvement raises conversion or contract value, guided by product usage signals rather than cold prospecting.