Find us at booth #83, join us for a harbor side happy hour, or catch Gorish’s talk.

Sept, 16-18 > Learn more

%20(1).avif)
Mamta Tainwala

July 24, 2026
%20(50).png)
Demand forecasting accuracy is measured, not felt: track MAPE (mean absolute percentage error) or its volume-weighted cousin WMAPE against actuals every cycle, monitor forecast bias to catch systematic over- or under-forecasting, and run forecast value added (FVA) to confirm your process beats a naive baseline. Most teams that claim an accuracy problem actually have a measurement problem: they have never computed any of these.
That is the thesis of this entire guide, so let us say it plainly: if you cannot name your current MAPE, you are not forecasting. You are publishing hopes on a schedule.
Four metrics cover it: MAPE averages the absolute percentage error per period, WMAPE weights errors by volume so big products count more, forecast bias tracks whether errors lean consistently high or low, and forecast value added (FVA) compares your process against a naive forecast to prove the effort earns its keep. Compute all four monthly against actuals.
The working definitions, with the formula and the reason each exists:
MAPE (mean absolute percentage error). Average of |actual − forecast| ÷ actual across periods, expressed as a percentage. The lingua franca of forecast accuracy: a 20% MAPE means your forecasts miss by a fifth on average. Its known weakness: it explodes on low-volume items where a small unit miss is a huge percentage.
WMAPE (weighted MAPE). Sum of absolute errors ÷ sum of actuals. Fixes MAPE's small-number problem by letting high-volume products dominate the score, which is usually what the business actually cares about. If you report one accuracy number upward, make it this one.
Forecast bias. Sum of (forecast − actual) over time, signed. Random errors cancel; bias does not. Persistent positive bias means systematic over-forecasting (hello, optimism and sandbagged targets), persistent negative means chronic under-calling demand. Bias is more fixable than error, because it usually has an organizational cause with a name and a job title.
FVA (forecast value added). Your forecast's accuracy versus a naive baseline (usually "next period equals last period" or simple seasonal repetition). This is the humility metric, and the most skipped one, because the finding is often embarrassing: every hour of judgment, adjustment, and executive override should beat the naive line, and in many organizations, the manual overrides make the forecast worse. FVA tells you which steps in your process to keep and which are expensive theater.
One prerequisite the metrics cannot fix for you: measure at the right level of aggregation. Accuracy at the total-company level is always flattering, because errors across products and segments cancel out. Accuracy at the SKU-week or segment-month level, where decisions actually get made, is where the truth lives. Pick the level your decisions run on, and measure there.
There is no universal "good" MAPE, and anyone quoting one without context is selling something. Accuracy depends on aggregation level (company-level forecasts routinely land within 5-10% while SKU-level errors of 30-50% are common), demand volatility, and forecast horizon. The honest benchmarks are your own trend and your FVA against naive.
This deserves the anti-BS treatment, because forecast software marketing loves a decontextualized accuracy claim. The same company can truthfully report 95% accuracy at annual-total level and 60% at monthly-segment level. Neither number means anything without its aggregation level, horizon, and metric definition attached.
So benchmark on three questions instead:
Are we beating naive? If your process cannot outperform "same as last period, adjusted for season," the process is a cost center. FVA answers this in one calculation.
Is our trend improving? MAPE and bias, tracked monthly, on the same aggregation level, for at least two quarters. Improvement is the benchmark.
Is bias near zero? Error is partly irreducible; bias is a choice. Confidence in the process starts here, and there is real room for improvement industry-wide: Gartner reported back in 2020 that fewer than half of sales leaders had high confidence in their organization's forecasting accuracy, and nothing in the years since suggests that number quietly healed itself.
Five causes account for most demand forecast misses: optimism bias treating every surge as the new normal, historical data whose patterns no longer hold, signal latency (reacting quarterly to markets that move weekly), unmodeled competitor moves, and fragmented data giving every team a different version of demand. Note that four of the five are process problems, not math problems.
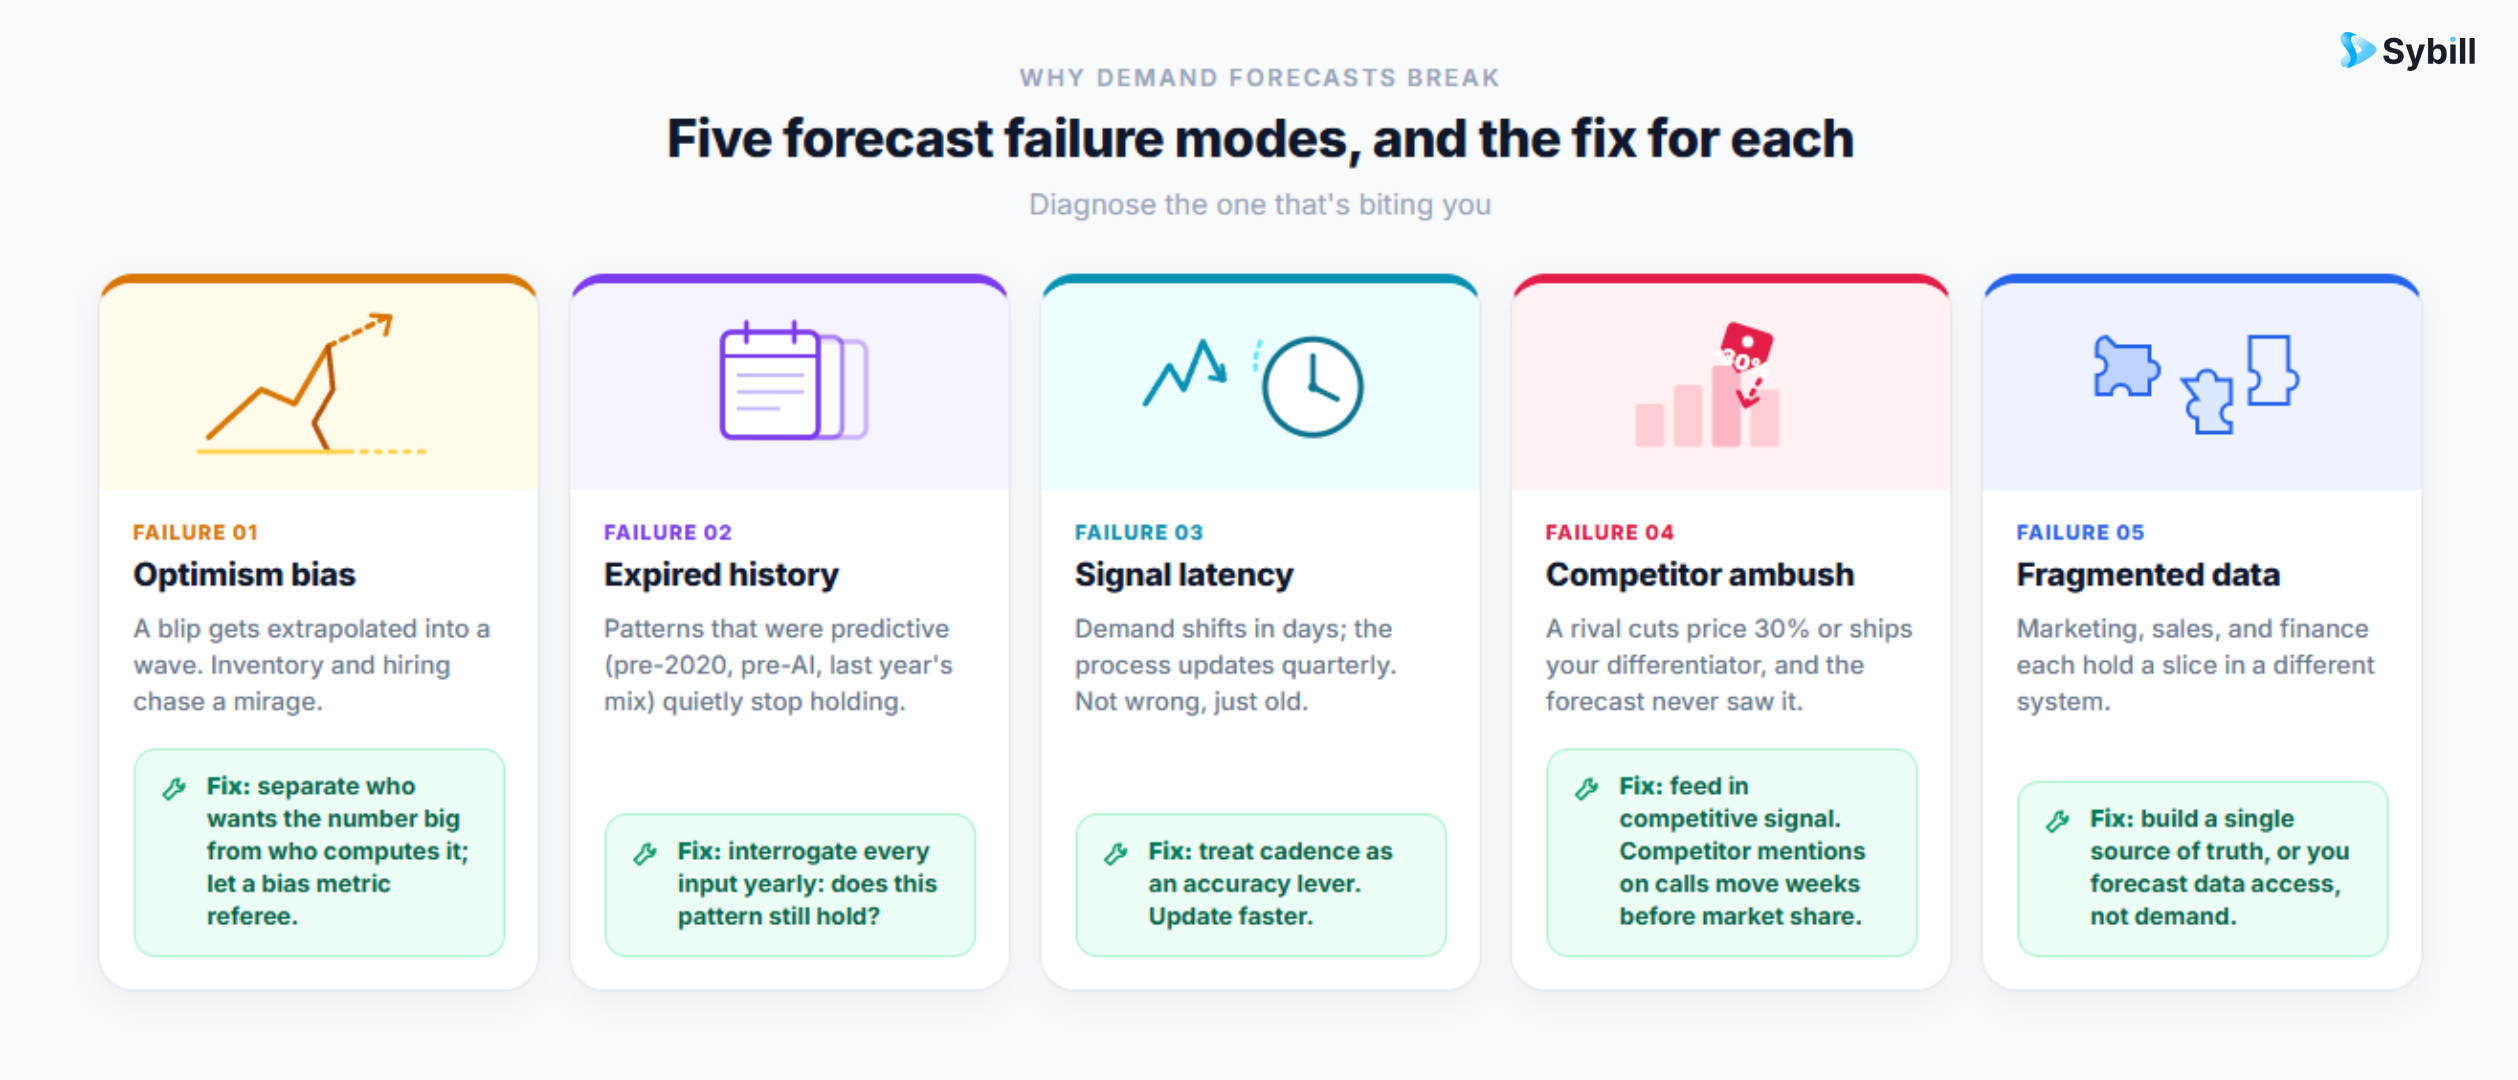
Optimism bias. A sales spike arrives, everyone extrapolates the wave, inventory and hiring follow, and the wave was a blip. The fix is structural, not motivational: separate the people who want the number to be big from the people who compute it, and let the bias metric referee.
Ghosts in the historical data. History is the raw material of every forecast and the source of its worst failures, because patterns expire. Pre-2020 buying behavior, pre-AI search behavior, last year's channel mix: each was predictive until suddenly it was not. Every model input deserves an annual "does this pattern still hold" interrogation.
Signal latency. Demand shifts now announce themselves in days (a viral moment, a competitor launch, a category budget freeze), while many forecasting processes still update quarterly. The forecast is not wrong so much as it is old. Cadence is an accuracy lever all by itself.
The competitor ambush. Your forecast assumed the competitive landscape of last quarter. Then a rival cut prices 30% or shipped the feature your differentiation rested on. Competitor behavior is a demand driver, and forecasts that do not consume competitive signal get mugged by it. This is one place B2B teams have an underused sensor: competitor mentions across sales calls shift weeks before market share numbers do.
Fragmented data. When marketing, sales, and finance each hold a different slice of demand evidence in a different system, the forecast is built on whichever fragment the forecaster could reach. A single source of truth is not a nice-to-have here; it is the difference between forecasting demand and forecasting your data access.
The classic cautionary tale still teaches: in the 1980s PC boom, industry forecasts promised 28 million business computers by 1987, and roughly 15 million had shipped by 1986, a miss documented in Harvard Business Review's post-mortem on total market demand forecasting. The one firm that got it right had asked the unglamorous foundational question (how many white-collar workers actually need a PC?) while everyone else extrapolated the hype curve. Forty years of better tools later, the failure mode has not changed. Only the spreadsheet got prettier.
The freshest demand signal you own is what buyers say on calls. Sybill captures every conversation and surfaces shifting needs, rising competitors, and budget language, weeks before the trend hits a dashboard. Start for free.
Six practices, in order of leverage: measure accuracy and FVA first so improvement is visible, forecast at the aggregation level decisions require, replace point forecasts with scenario ranges, feed the model fresh signals including conversation data, run a documented forecast-versus-actual review every cycle, and apply AI only after the data foundation is clean.
1. Measure before you improve. Everything in the first section of this guide, running monthly, on a visible dashboard. Teams that start measuring typically improve in the first quarter with no other change, because visibility alone kills the worst habits. You cannot manage a number nobody computes. And measure whatever method you run: the metrics above work identically whether your underlying approach comes from our guide to forecasting methods or a dedicated platform from our forecasting tools roundup.
2. Forecast where the decisions are. If inventory, hiring, and pipeline coverage targets are set monthly by segment, forecast monthly by segment, and grade yourself there. Accuracy at levels nobody acts on is decoration.
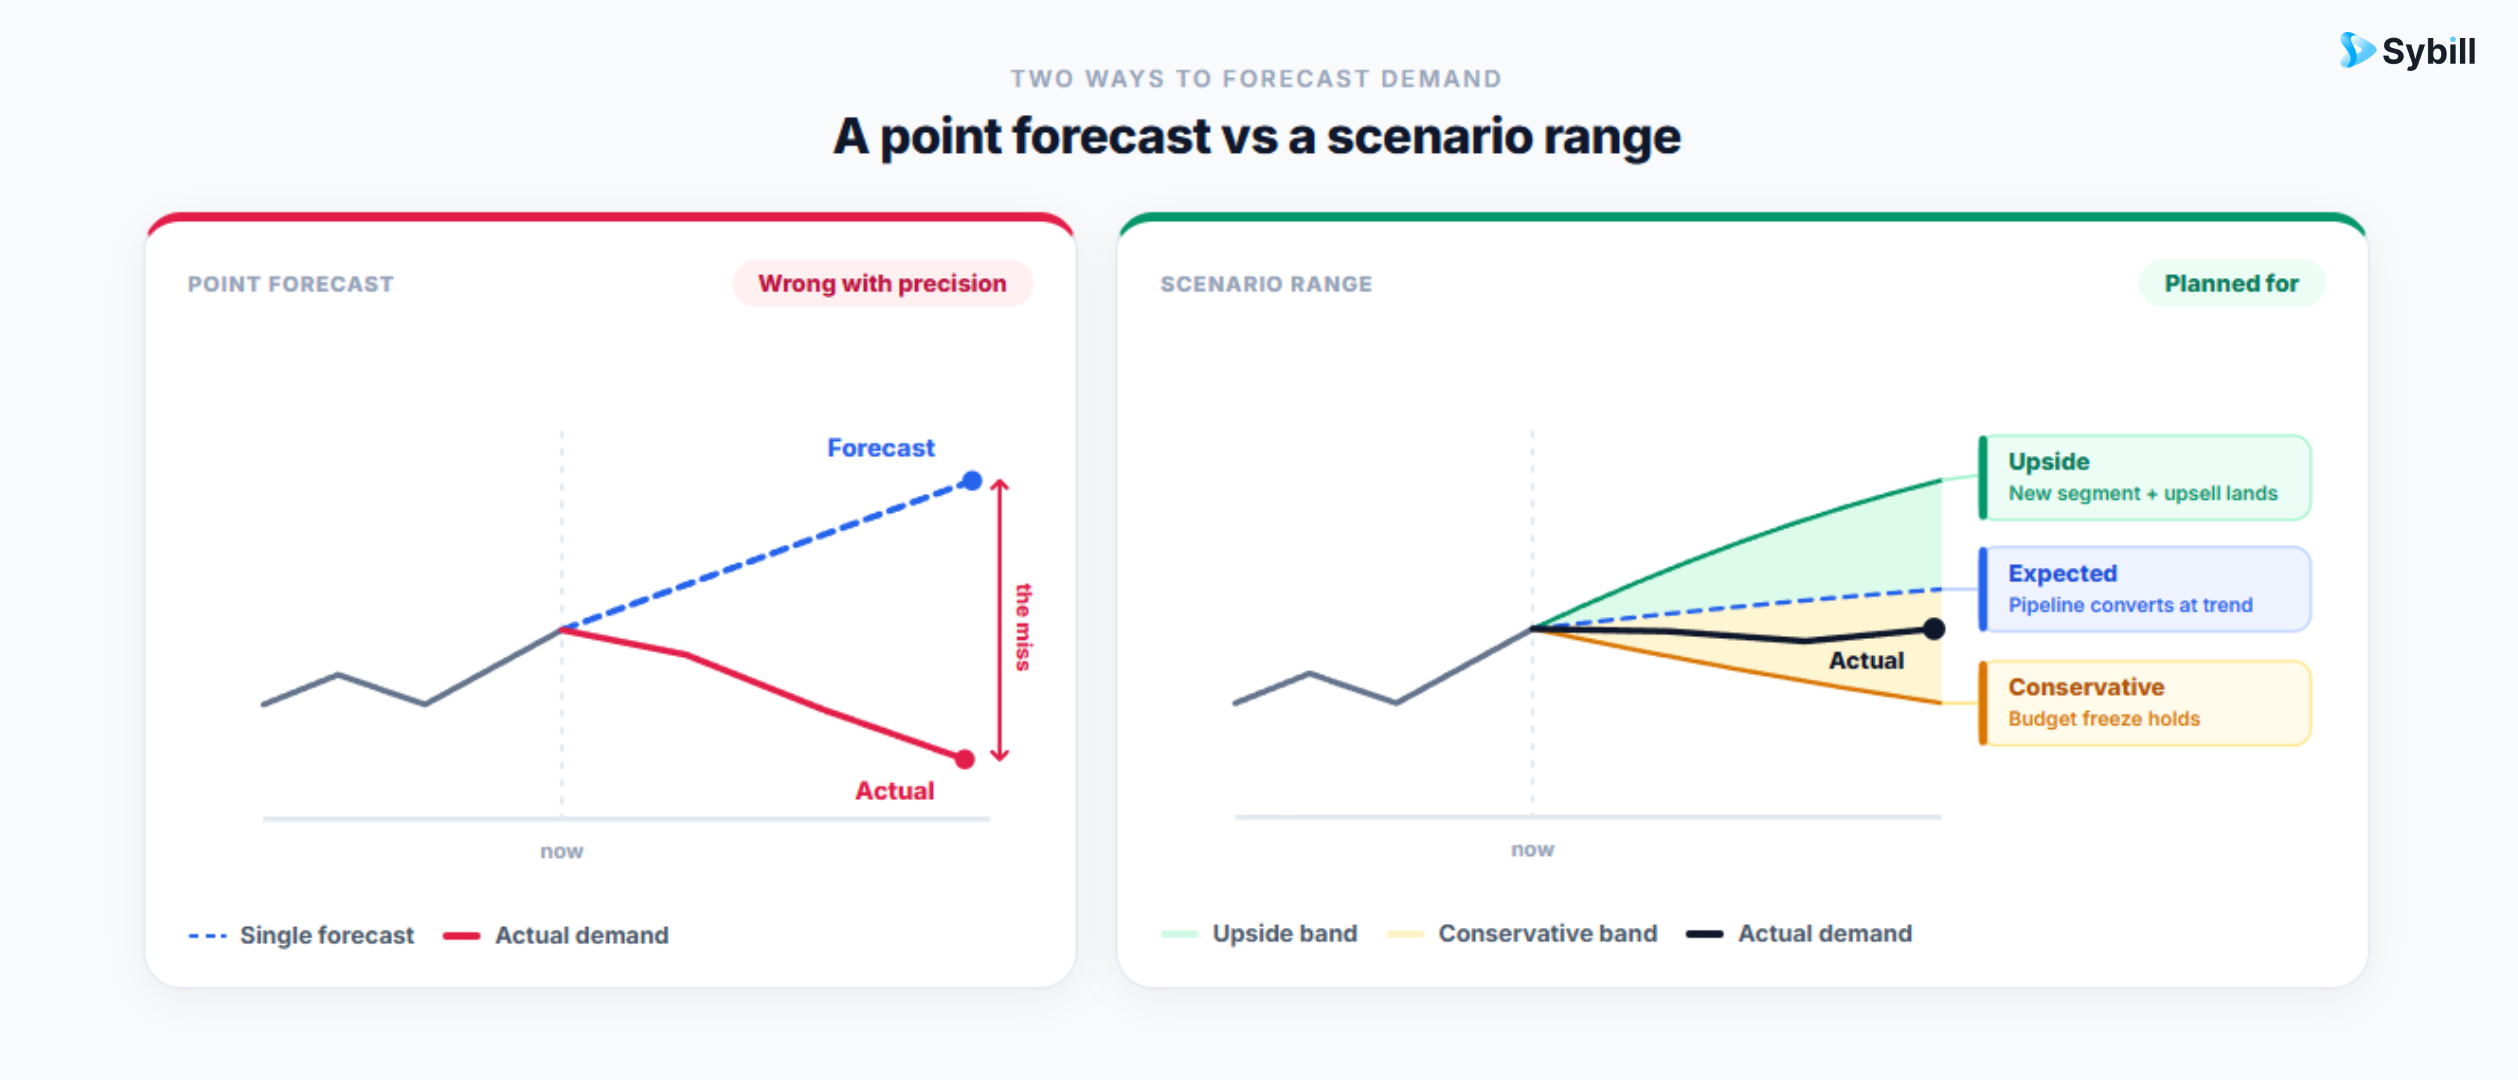
3. Ranges beat points. A single-number forecast is a false promise with decimal places. Publish three scenarios (conservative, expected, upside) with the assumptions that separate them, so downstream teams plan for a distribution instead of anchoring on one number that is guaranteed to be wrong by some amount. The assumptions list also makes the post-mortem honest: when reality picks a scenario, you know which assumption drove it.
4. Feed it fresh signals. Historical sales data is the base layer, not the whole diet. Add leading indicators: search and trial trends, engagement data, and, for B2B, the richest and least-harvested source, buyer conversations. What prospects ask about, object to, and compare you against shifts before revenue does. Buyer intelligence across your call base turns that into a structured demand signal, and Sybill has analyzed over 33 Million sales conversations, where the consistent pattern is that changes in buyer language lead changes in buying by a quarter or more. Query it directly with Ask Sybill: "What new use cases came up in discovery calls this month?" is a demand research question with an instant answer.
5. Close the loop, every cycle. Forecast versus actual, misses documented with causes, model adjusted, next cycle. The discipline mirrors win-loss analysis: the miss is tuition, and the review is how you collect the education. Feed the same rigor into your forecast calls so the demand view and the sales view reconcile in public.
6. AI last, on clean data. Machine learning genuinely improves demand forecasting: it digests more variables, catches nonlinear patterns, and flags anomalies humans smooth over. Predictive analytics is the real deal. But AI on fragmented, biased, unaudited data just reaches the wrong answer faster and with more confidence. Fix the foundation, then add the horsepower. And a lane note for clarity: dedicated demand planning platforms own the statistical modeling layer; Sybill's contribution to demand accuracy is the conversation signal and the clean CRM substrate that RevOps feeds into those models.
Accuracy improves fastest with one named owner (typically finance, ops, or RevOps) running the measurement cadence, and structured input from the teams holding demand evidence: sales on buyer signals, marketing on top-of-funnel trends, product on usage shifts. What breaks accuracy is the committee forecast, where every stakeholder negotiates the number toward their incentive.
The short version of a long organizational story: forecasts get worse every time someone with a stake in the answer touches the number. Sales wants it low (beatable), finance wants it achievable (fundable), the board wants it high (fundraisable). The fix is separating evidence from targets. Everyone contributes signal; one owner computes the forecast; targets get negotiated separately, on top of it, in the open.
Sales leaders sit in the most valuable seat here, because their teams hold the freshest evidence in the building. The forecast owner who taps conversation data directly, instead of waiting for it to be filtered through three layers of optimism, gets the demand shift a quarter early. That is the entire game.
Strip away the metrics and the acronyms, and demand forecasting accuracy comes down to one uncomfortable practice: writing down what you predicted, comparing it to what happened, and letting the gap change how you predict next time. In public. On a schedule. Forever.
Most organizations never do this, which is why most forecasts are astrology with a header row. The ones that do build a compounding advantage: models that learn, bias that shrinks, and plans built on ranges that reality keeps landing inside.
The measurement is yours to run. The freshest signal feeding it is what your buyers are saying right now, on this week's calls, and that layer is Sybill's job: captured, structured, and queryable before the trend has a name.
Try Sybill free or book a demo and give your demand forecast its leading indicator.
There is no universal target: MAPE depends heavily on aggregation level, volatility, and horizon. Company-level forecasts often achieve 5 to 10% MAPE while SKU-level or segment-level forecasts commonly run 30 to 50%. Benchmark against your own trend and against a naive forecast rather than a borrowed number.
MAPE averages the percentage error of each item equally, which lets low-volume items with huge percentage misses distort the score. WMAPE divides total absolute error by total actual volume, weighting big products more. For a single reported accuracy number, WMAPE usually reflects business impact better.
FVA measures whether each step of your forecasting process improves accuracy versus a naive baseline, such as "next period equals last period." It regularly reveals that manual overrides and executive adjustments make forecasts worse, which makes it the fastest way to find and remove process steps that subtract value.
Bias is the signed, persistent direction of your errors: consistently forecasting high or consistently low. Unlike random error, bias almost always has an organizational cause, such as optimistic sales inputs or sandbagged targets, which makes it the most fixable component of inaccuracy. Track it separately from MAPE.
Demand forecasting predicts total market appetite for your product, unconstrained by your capacity; sales forecasting predicts what your team will close from existing pipeline. They answer different questions and are owned by different teams. We cover the full comparison in our demand vs sales forecasting guide.
There is no universal target: MAPE depends heavily on aggregation level, volatility, and horizon. Company-level forecasts often achieve 5 to 10% MAPE while SKU-level or segment-level forecasts commonly run 30 to 50%. Benchmark against your own trend and against a naive forecast rather than a borrowed number.
MAPE averages the percentage error of each item equally, which lets low-volume items with huge percentage misses distort the score. WMAPE divides total absolute error by total actual volume, weighting big products more. For a single reported accuracy number, WMAPE usually reflects business impact better.
FVA measures whether each step of your forecasting process improves accuracy versus a naive baseline, such as "next period equals last period." It regularly reveals that manual overrides and executive adjustments make forecasts worse, which makes it the fastest way to find and remove process steps that subtract value.