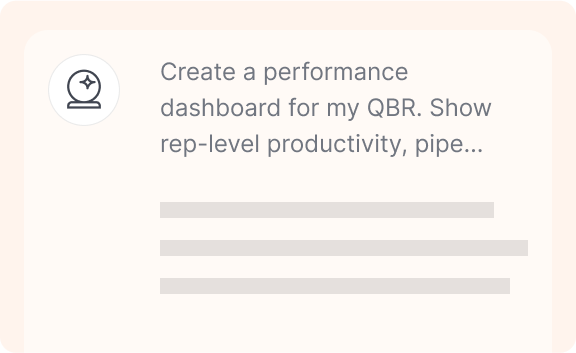
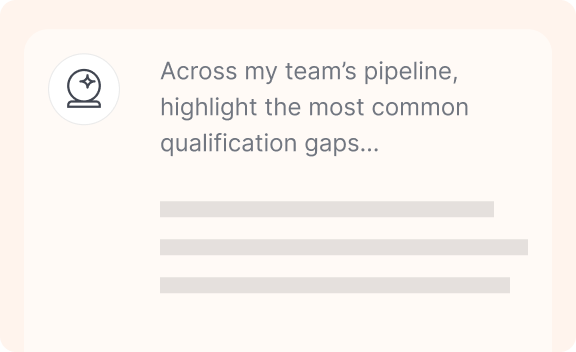
Create a performance dashboard for my QBR. Cover this quarter vs. last quarter and highlight deltas, trends, and outliers.
– Rep-level productivity: meetings held, opps created, stage progression, activity → outcome ratios
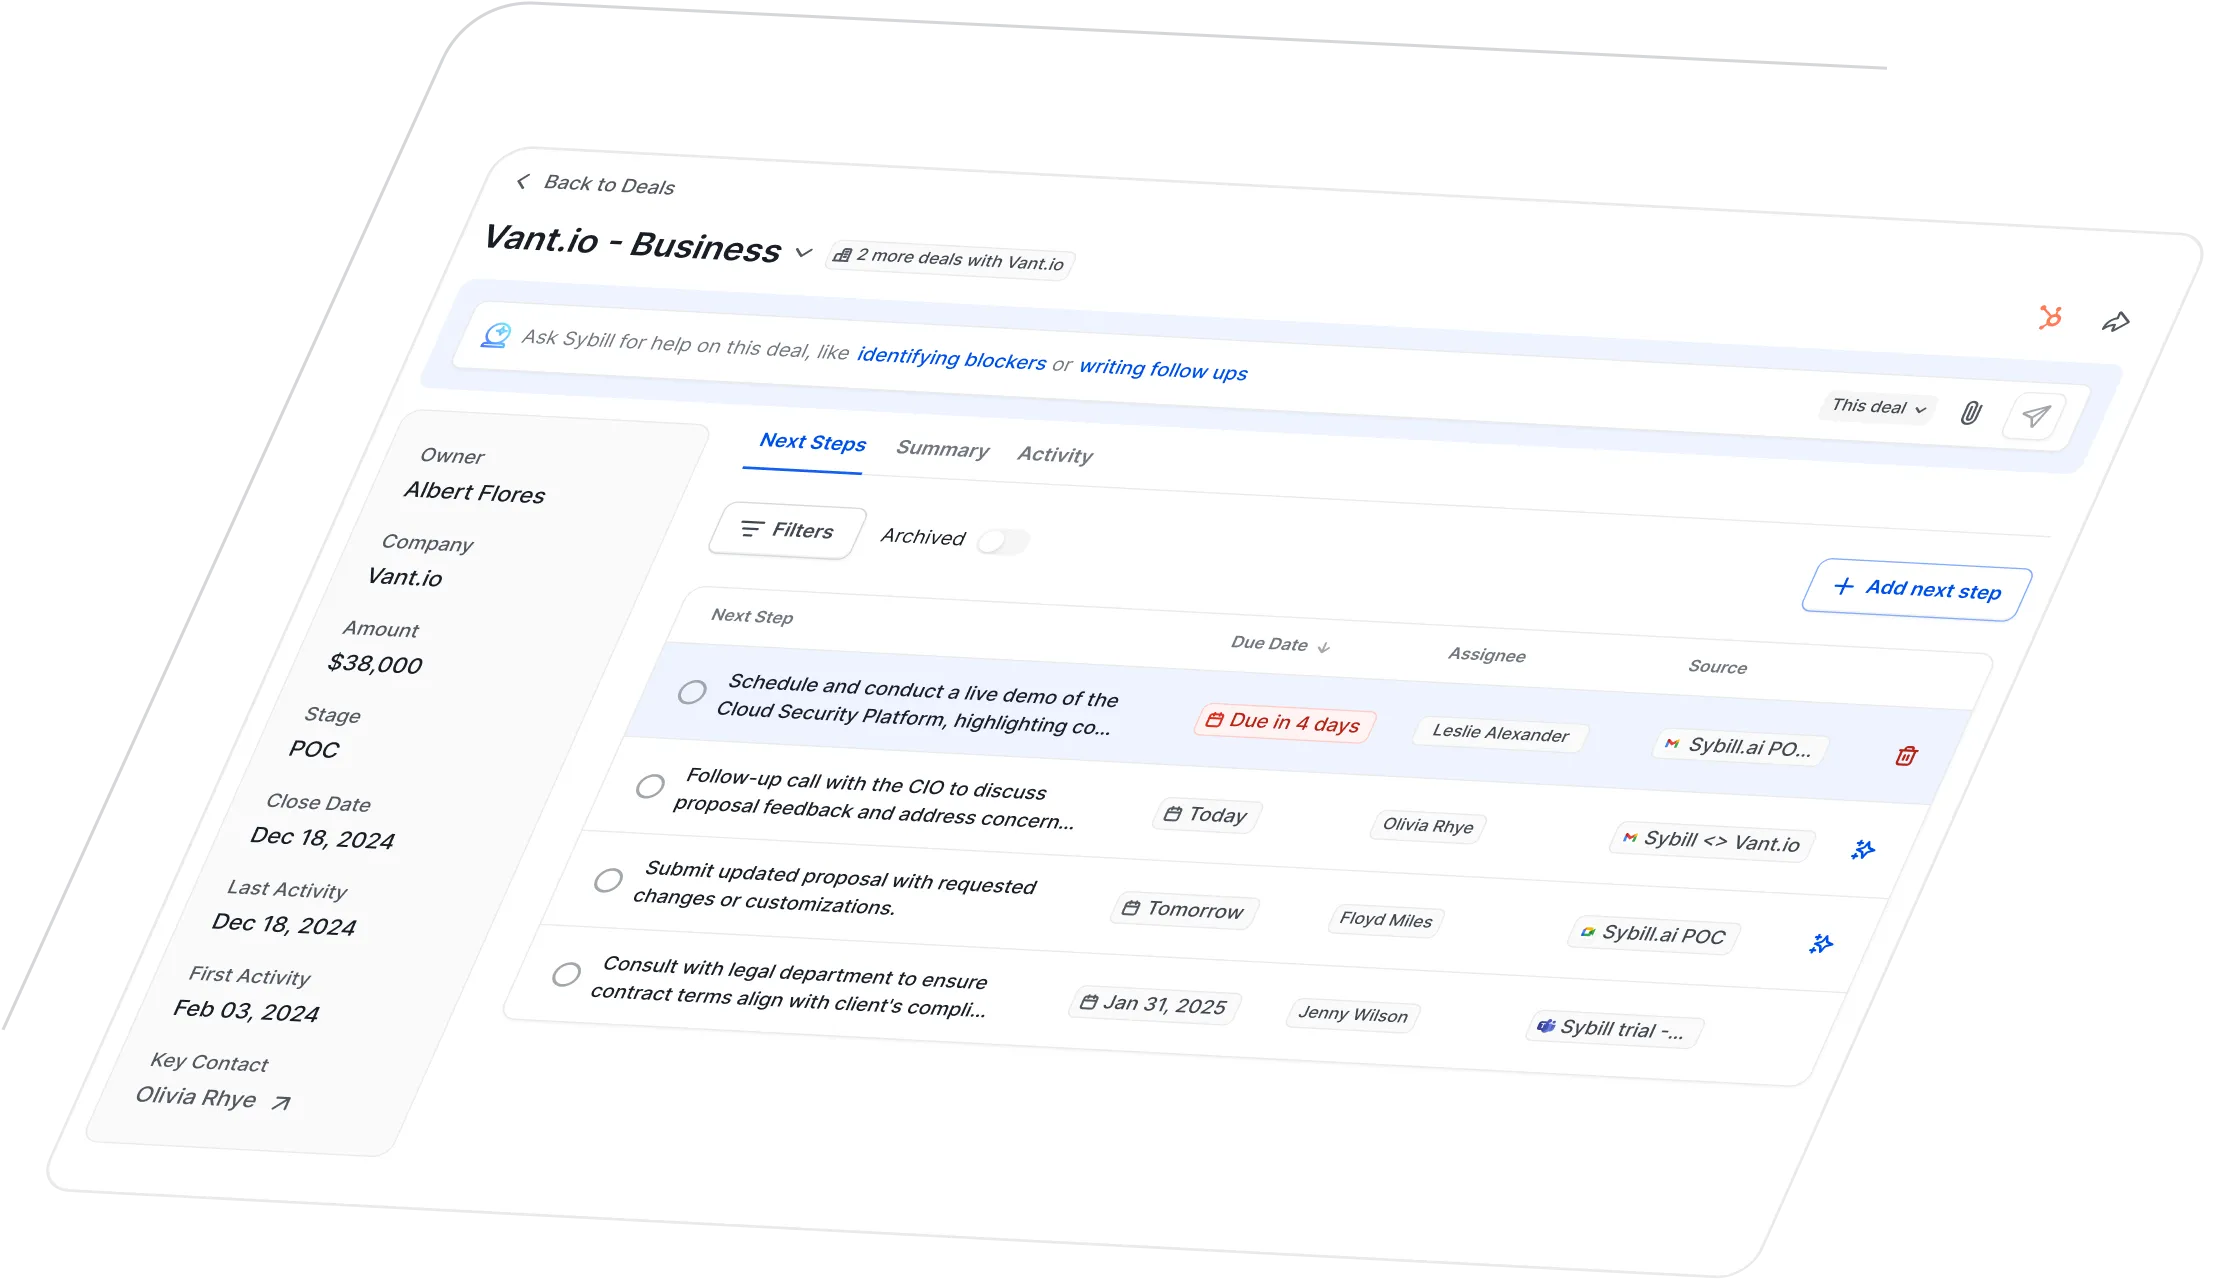
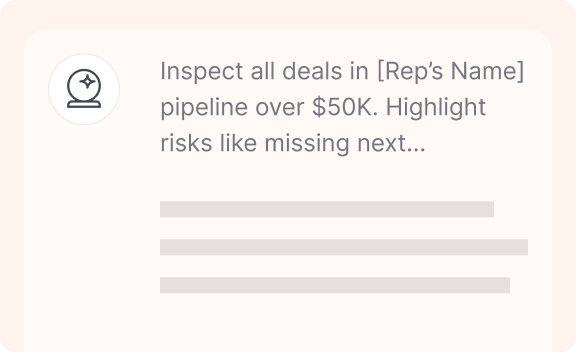
– Pipeline hygiene: stale opps, next-step coverage, close-date pushes, CRM completeness, forecast risk
– Win/loss trends: by segment, source, competitor, reason code, average sales cycle
– Training impact: before/after metrics for targeted skills (e.g., discovery quality, objection handling, talk ratios), participation vs. performance lift
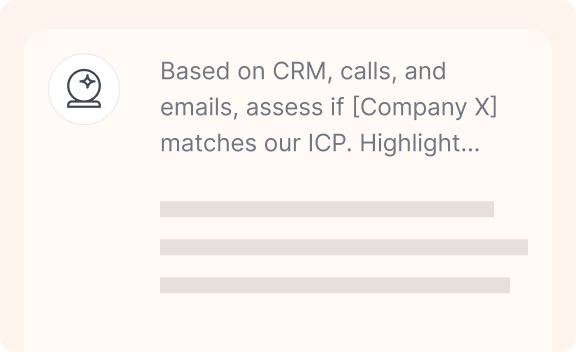
– Benchmarks: compare to team average and top quartile; flag top/bottom performers
– Callouts: 5 key insights, 3 risks to address, 3 opportunities to pursue next quarter
Include a short executive summary (≤120 words) and a prioritized action plan for the next quarter.


.jpeg)


.png)
.png)


.png)